
Exhibit 99.1 One of the Leading Global Franchisors of Boutique Health & Wellness Brands

Legal Disclaimer The information contained in this presentation is provided solely for the purpose of acquainting the readers with Xponential Fitness, Inc. (the “Company,” “Xponential” or “we”) and its business operations, strategies and financial performance. This presentation and any accompanying oral statements is not an offer to sell nor is it a solicitation of any offer to buy any securities and conveys no right, title or interest in the Company or the products of its business activities. Nothing in this presentation constitutes an offer of securities for sale in any jurisdiction where it is unlawful to do so. This presentation does not constitute an offering of securities that will be registered or qualified under the Securities Act of 1933, any United States state securities or “blue sky” laws of the securities laws of any other jurisdiction. Cautionary Note Regarding Forward-Looking Statements This presentation contains forward-looking statements that are based on current expectations, estimates, forecasts and projections of future performance based on management’s judgment, beliefs, current trends, and anticipated financial performance. These forward-looking statements include, without limitation, statements relating to expected growth of our business; projected number of new studio openings; profitability; the expected impact of our movement away from company-owned transition studios; anticipated industry trends; projected financial and performance information such as system-wide sales; projected annual revenue, Adjusted EBITDA and other statements on the slides “Capital Structure: Net Debt Deleveraging on Adj. EBITDA Growth,” “FY 2025 Guidance – As of May 8, 2025,” “Optimizing Capital Allocation Improves SG&A Leverage,” “Capital Structure: Net Debt Deleveraging on Adj. EBITDA Growth” and “Growth Algorithm Targets”, our competitive position in the boutique fitness industry and broader health and wellness trends; our efforts to optimize our capital structure, and ability to execute our business strategies and our strategic growth drivers. Forward-looking statements involve risks and uncertainties that may cause actual results to differ materially from those contained in the forward-looking statements. These factors include, but are not limited to, the outcome of ongoing and any future government investigations and litigation to which we are subject; our ability to retain key senior management and key employees, our relationships with master franchisees, franchisees and international partners; difficulties and challenges in opening studios by franchisees; the ability of franchisees to generate sufficient revenues; risks relating to expansion into international markets; loss of reputation and brand awareness; geopolitical uncertainty, including the impact of the presidential administration in the U.S., trade policies and tariffs; general economic conditions and industry trends; and other risks as described in our SEC filings, including our Annual Report on Form 10-K for the full year ended December 31, 2024 filed by Xponential with the SEC and other periodic reports filed with the SEC. Other unknown or unpredictable factors or underlying assumptions subsequently proving to be incorrect could cause actual results to differ materially from those in the forward-looking statements. Although we believe that the expectations reflected in the forward-looking statements are reasonable, we cannot guarantee future results, level of activity, performance, or achievements. You should not place undue reliance on these forward-looking statements. All information provided in this presentation is as of today’s date, unless otherwise stated, and Xponential undertakes no duty to update such information, except as required under applicable law. Market Data and Non-GAAP Financial Measures This presentation includes statistical and other industry and market data that we obtained from industry publications and research, surveys, studies and other similar third-party sources, as well as our estimates based on such data and on our internal sources. Such data and estimates involve a number of assumptions and limitations, and you are cautioned not to give undue weight to such data and estimates. We believe that the information from these third-party sources is reliable; however, we have not independently verified them, we make no representation as to their accuracy or completeness and we do not undertake to update the data from such sources after the date of this presentation. Further, our business and the industry in which we operate is subject to a high degree of risk and uncertainty, which could cause results to differ materially from those expressed in the estimates made by the third-party sources and by us. We use certain non-GAAP financial information in this presentation, such as EBITDA, Adjusted EBITDA, Adjusted Free Cash Flow and Adjusted Levered Free Cash Flow. We are providing, simultaneously with this presentation, related information and reconciliations for the non- GAAP financial measures to the most directly comparable financial measures stated in accordance with GAAP online at: https://investor.xponential.com/ In addition to our results determined in accordance with GAAP, we believe non-GAAP financial measures are useful in evaluating our operating performance. We use certain non-GAAP financial information in this presentation, such as EBITDA, Adjusted EBITDA and adjusted net income (loss), and adjusted net earnings (loss) per share, which exclude certain non-operating or non-recurring items, including but not limited to, equity-based compensation and related employer payroll taxes, acquisition and transaction expenses (income) (including change in contingent consideration and transaction bonuses), litigation expenses (consisting of legal and related fees for specific proceedings that arise outside of the ordinary course of our business), fees for financial transactions, such as secondary public offering expenses for which we do not receive proceeds (including bonuses paid to executives related to completion of such transactions) and other contemplated corporate transactions, expense related to the remeasurement of our TRA obligation, expense related to loss on impairment or write down of goodwill and other assets, loss (gain) and ongoing expenses related to brand divestitures and wind down (including ongoing expenses directly related to the divested or wound down brands for arrangements that existed prior to divestiture or wind down), transformation initiative costs (primarily consisting of third-party professional consulting fees related to modifications of our business strategy and cost saving initiatives), and restructuring and related charges incurred in connection with our restructuring plan that we do not believe reflect our underlying business performance and affect comparability, to evaluate our ongoing operations and for internal planning and forecasting purposes. We believe that non-GAAP financial information, when taken collectively with comparable GAAP financial measures, is helpful to investors because it provides consistency and comparability with past financial performance and provides meaningful supplemental information regarding our performance by excluding certain items that may not be indicative of our business, results of operations or outlook. However, non- GAAP financial information is presented for supplemental informational purposes only, has limitations as an analytical tool, and should not be considered in isolation or as a substitute for financial information presented in accordance with GAAP. In addition, other companies, including companies in our industry, may calculate similarly titled non-GAAP measures differently or may use other measures to evaluate their performance, all of which could reduce the usefulness of our non-GAAP financial measures as tools for comparison. We seek to compensate such limitations by providing a detailed reconciliation for the non-GAAP financial measures to the most directly comparable financial measures stated in accordance with GAAP. Investors are encouraged to review the related GAAP financial measures and the reconciliation of the non-GAAP financial measures to their most directly comparable GAAP financial measures and not rely on any single financial measure to evaluate our business. In addition, we are not able to provide a quantitative reconciliation of the estimated full-year Adjusted EBITDA for fiscal years ending December 31, 2025, 2026 or 2027 without unreasonable efforts to the most directly comparable GAAP financial measure due to the high variability, complexity and low visibility with respect to certain items such as taxes, TRA remeasurements, and income and expense from changes in fair value of contingent consideration from acquisitions. We expect the variability of these items to have a potentially unpredictable and potentially significant impact on future GAAP financial results, and, as such, we also believe that any reconciliations provided would imply a degree of precision that would be confusing or misleading to investors. 2

MARK Chief Executive Officer KING 3
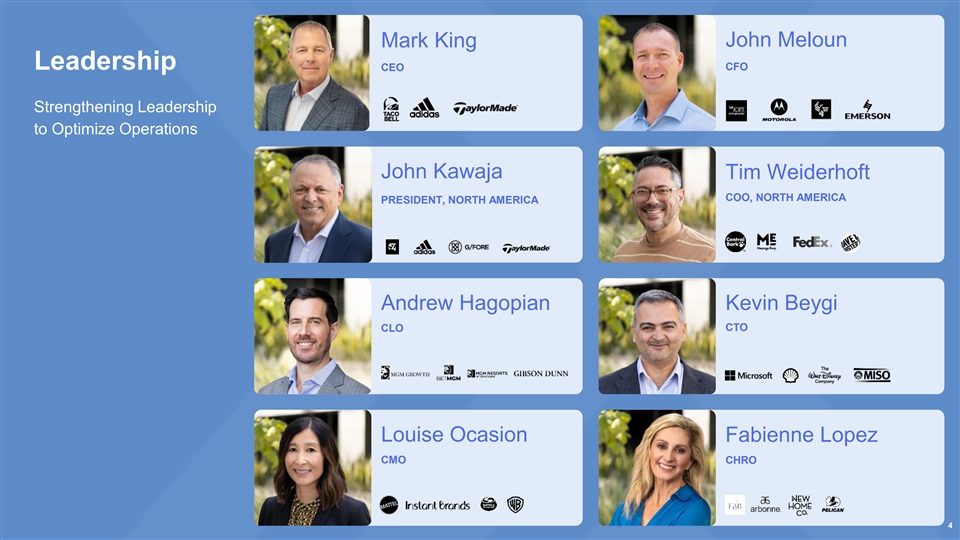
John Meloun Mark King Leadership CFO CEO Strengthening Leadership to Optimize Operations John Kawaja Tim Weiderhoft COO, NORTH AMERICA PRESIDENT, NORTH AMERICA Andrew Hagopian Kevin Beygi CLO CTO Louise Ocasion Fabienne Lopez CMO CHRO 4 4
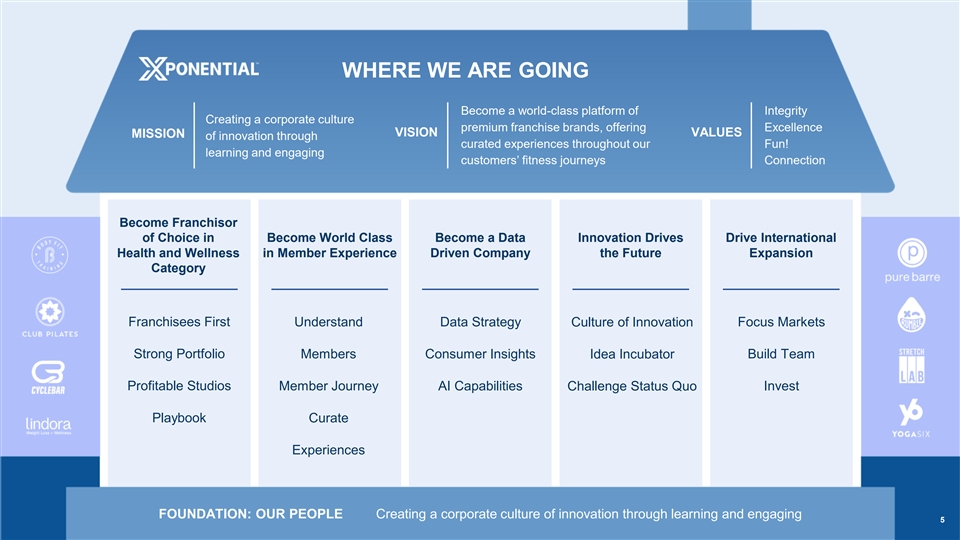
WHERE WE ARE GOING Become a world-class platform of Integrity Creating a corporate culture premium franchise brands, offering Excellence VISION VALUES MISSION of innovation through curated experiences throughout our Fun! learning and engaging customers’ fitness journeys Connection Become Franchisor of Choice in Become World Class Become a Data Innovation Drives Drive International Health and Wellness in Member Experience Driven Company the Future Expansion Category Franchisees First Understand Data Strategy Culture of Innovation Focus Markets Strong Portfolio Members Consumer Insights Idea Incubator Build Team Profitable Studios Member Journey AI Capabilities Challenge Status Quo Invest Playbook Curate Experiences FOUNDATION: OUR PEOPLE Creating a corporate culture of innovation through learning and engaging 5
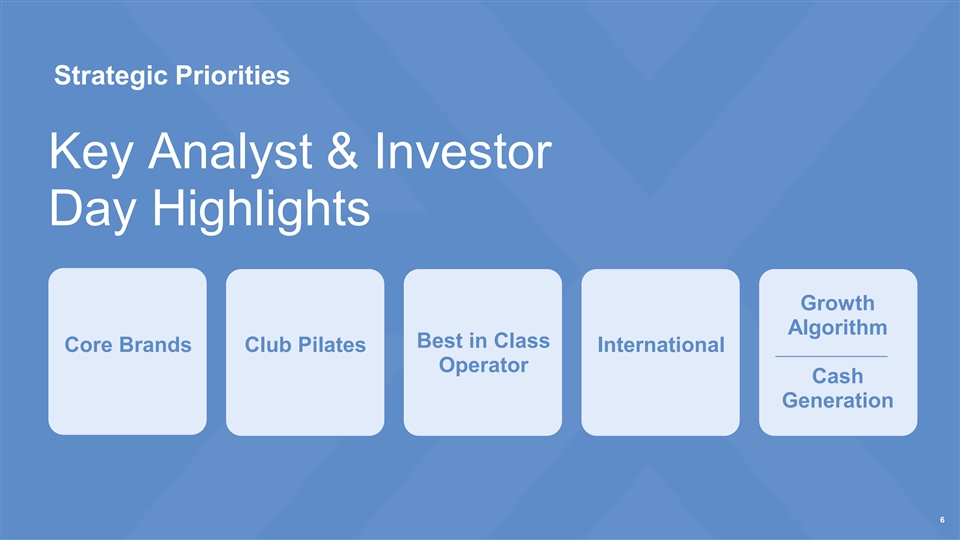
Strategic Priorities Key Analyst & Investor Day Highlights Growth Algorithm Best in Class Core Brands Club Pilates International Operator Cash Generation 6
JOHN President, North America KAWAJA 7
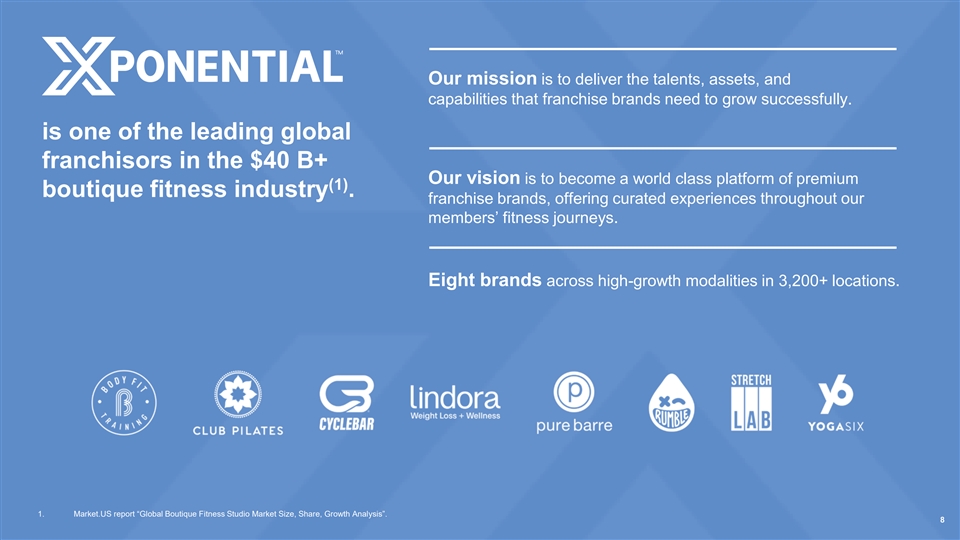
Our mission is to deliver the talents, assets, and capabilities that franchise brands need to grow successfully. is one of the leading global franchisors in the $40 B+ Our vision is to become a world class platform of premium (1) boutique fitness industry . franchise brands, offering curated experiences throughout our members’ fitness journeys. Eight brands across high-growth modalities in 3,200+ locations. 1. Market.US report “Global Boutique Fitness Studio Market Size, Share, Growth Analysis”. 8
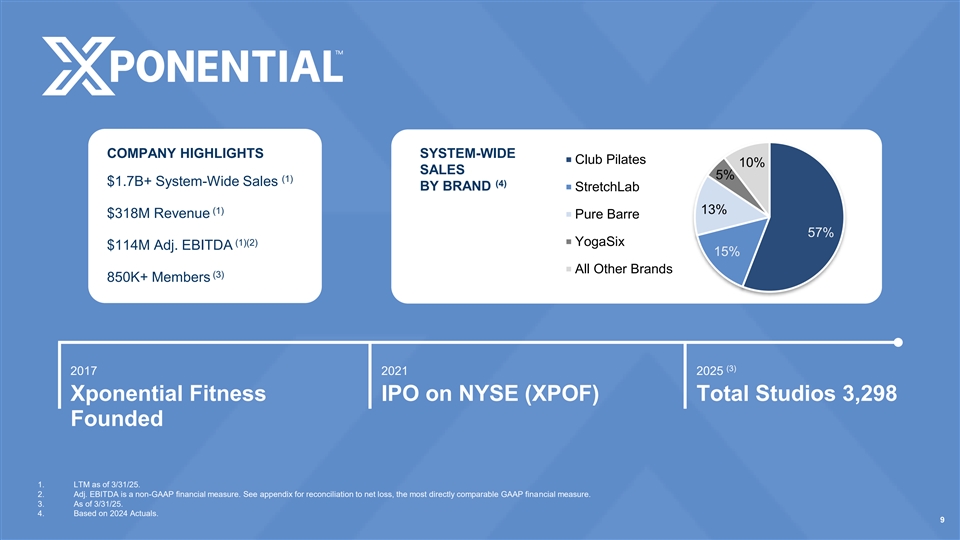
COMPANY HIGHLIGHTS SYSTEM-WIDE Club Pilates 10% SALES 5% (1) $1.7B+ System-Wide Sales (4) BY BRAND StretchLab (1) 13% $318M Revenue Pure Barre 57% (1)(2) YogaSix $114M Adj. EBITDA 15% All Other Brands (3) 850K+ Members (3) 2017 2021 2025 Xponential Fitness IPO on NYSE (XPOF) Total Studios 3,298 Founded 1. LTM as of 3/31/25. 2. Adj. EBITDA is a non-GAAP financial measure. See appendix for reconciliation to net loss, the most directly comparable GAAP financial measure. 3. As of 3/31/25. 4. Based on 2024 Actuals. 9
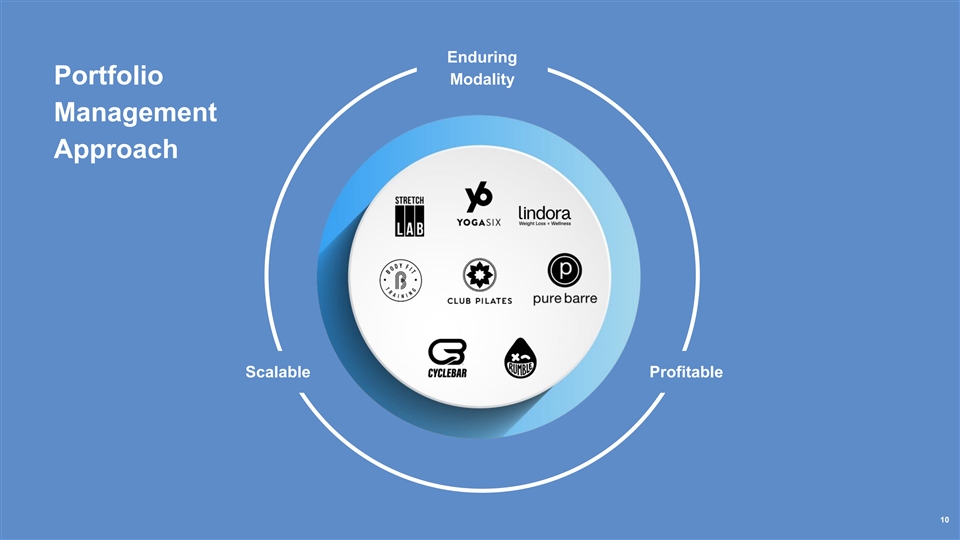
Enduring Portfolio Modality Management Approach Scalable Profitable 10

Most established Highly fragmented Brand modality in fitness marketplace momentum 11

Committed Leading Strong community market share fundamentals 12

Early innings Wide consumer Reimagine reach the business model 13

14

Clear Market Leader Over 1,200 8x larger than Fastest 500K+ International studios next growing members success competitor 15
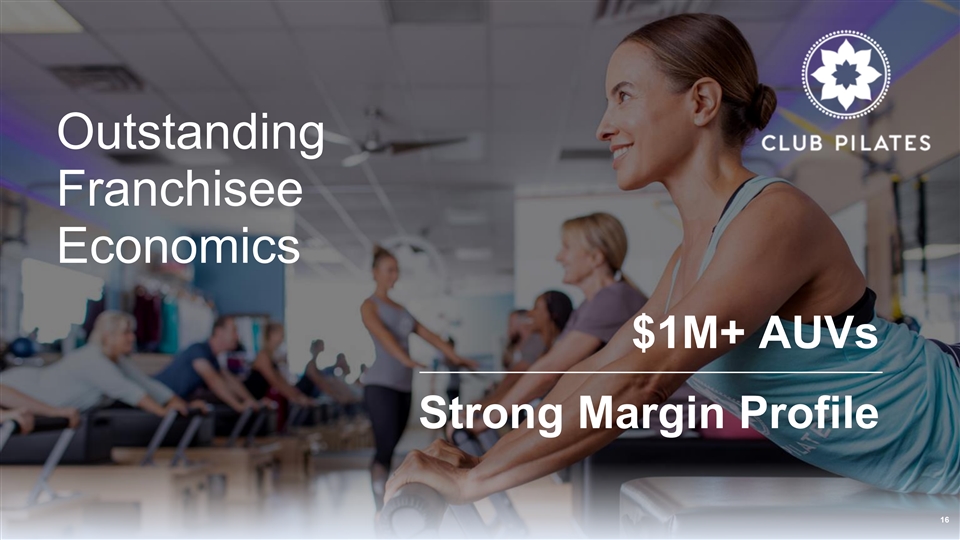
Outstanding Franchisee Economics $1M+ AUVs Strong Margin Profile 16
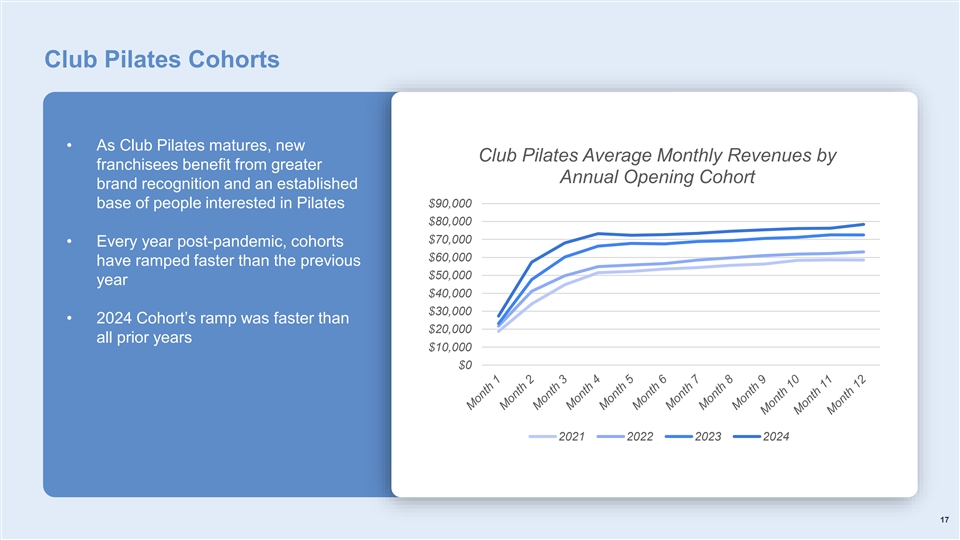
Club Pilates Cohorts • As Club Pilates matures, new Club Pilates Average Monthly Revenues by franchisees benefit from greater Annual Opening Cohort brand recognition and an established base of people interested in Pilates $90,000 $80,000 $70,000 • Every year post-pandemic, cohorts $60,000 have ramped faster than the previous $50,000 year $40,000 $30,000 • 2024 Cohort’s ramp was faster than $20,000 all prior years $10,000 $0 2021 2022 2023 2024 17
Xponential’s Crown Jewel 1 ~ 56% of System-Wide Sales High EBITDA Contribution 1. System-Wide Sales based on 2024 Actuals 18

From Building Great Brands to Best-in-Class Operator 19

Marketing Transformation Strong Brands Strong Community 20

Driving Sales Growth Through Actionable Consumer Insights Understanding Our Consumer 21
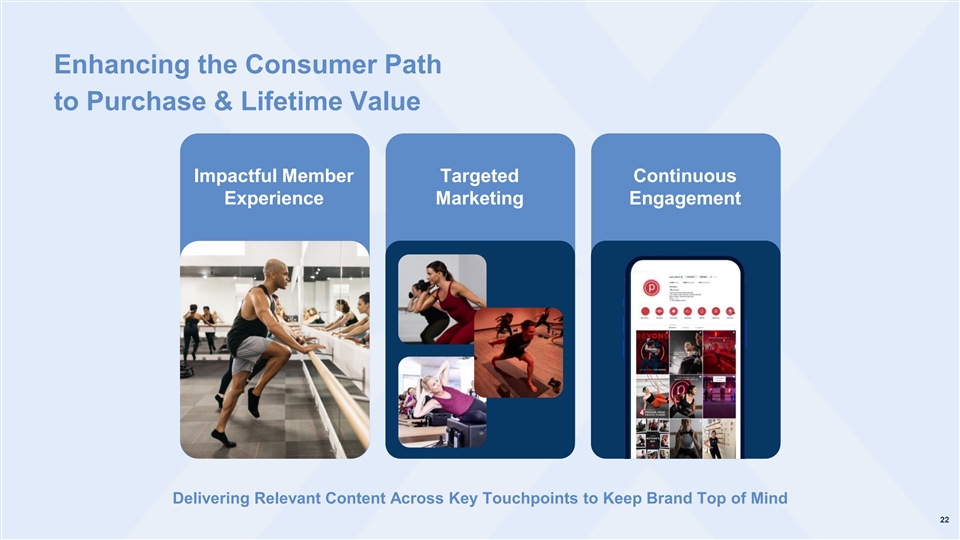
Enhancing the Consumer Path to Purchase & Lifetime Value Impactful Member Targeted Continuous Experience Marketing Engagement Delivering Relevant Content Across Key Touchpoints to Keep Brand Top of Mind 22
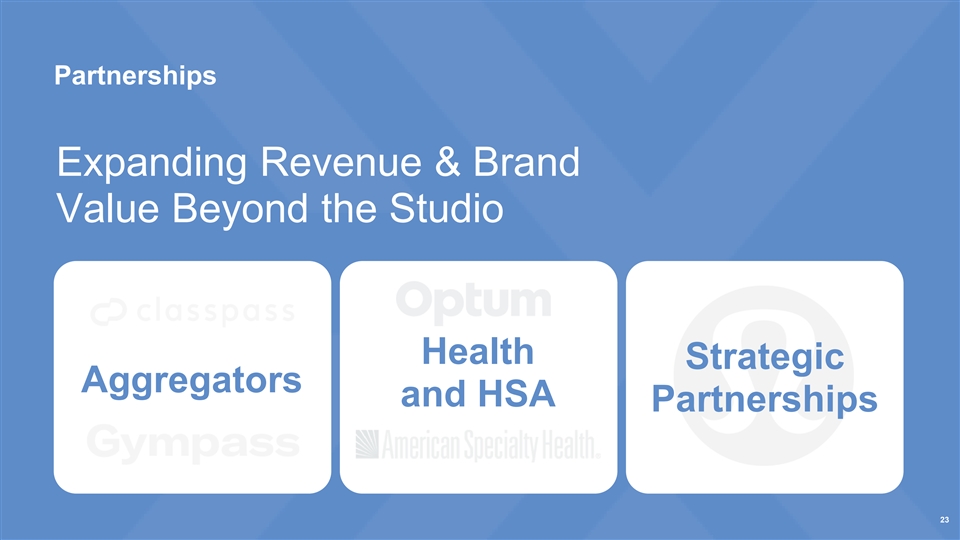
Partnerships Expanding Revenue & Brand Value Beyond the Studio Health Strategic Aggregators and HSA Partnerships 23
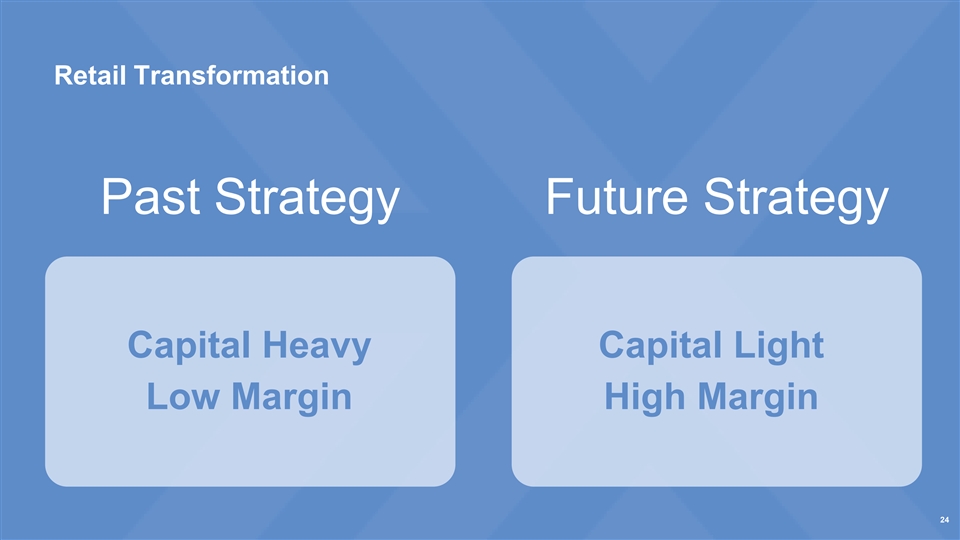
Retail Transformation Past Strategy Future Strategy Capital Heavy Capital Light Low Margin High Margin 24

10 MIN. BREAK 25
TIM Chief Operating Officer, North America WEIDERHOFT 26
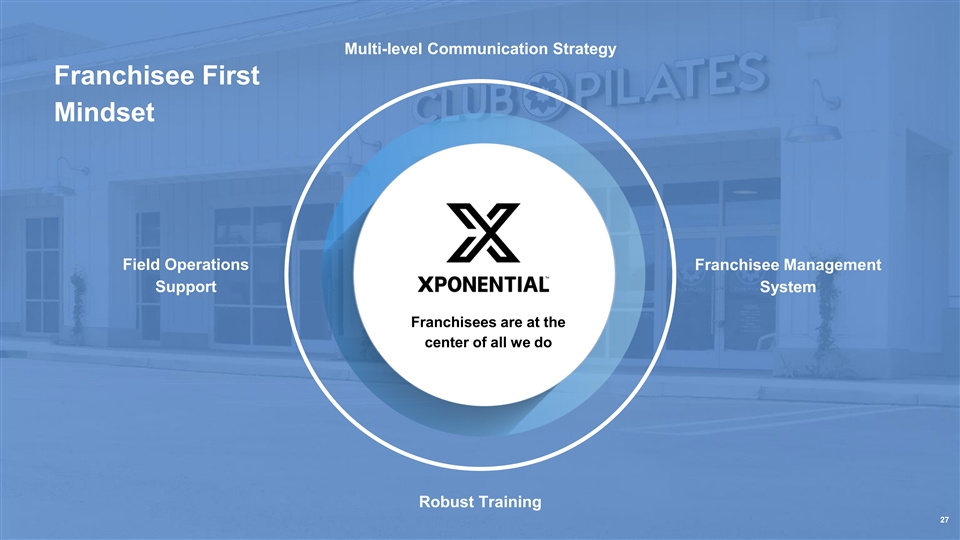
Multi-level Communication Strategy Franchisee First Mindset Field Operations Franchisee Management Support System Franchisees are at the center of all we do Robust Training 27
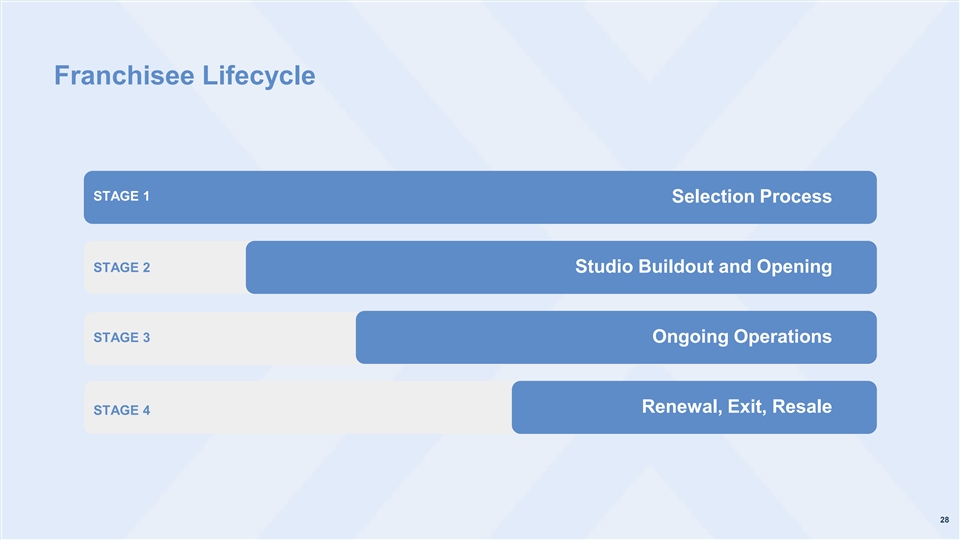
Franchisee Lifecycle STAGE 1 Selection Process STAGE 2 Studio Buildout and Opening STAGE 3 Ongoing Operations Renewal, Exit, Resale STAGE 4 28
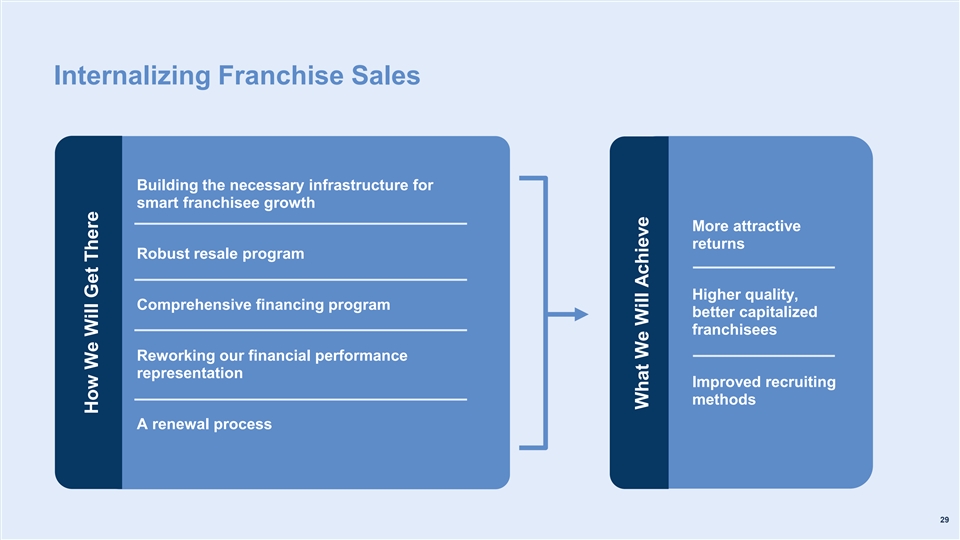
Internalizing Franchise Sales Building the necessary infrastructure for smart franchisee growth More attractive returns Robust resale program Higher quality, Comprehensive financing program better capitalized franchisees Reworking our financial performance representation Improved recruiting methods A renewal process 29 How We Will Get There What We Will Achieve
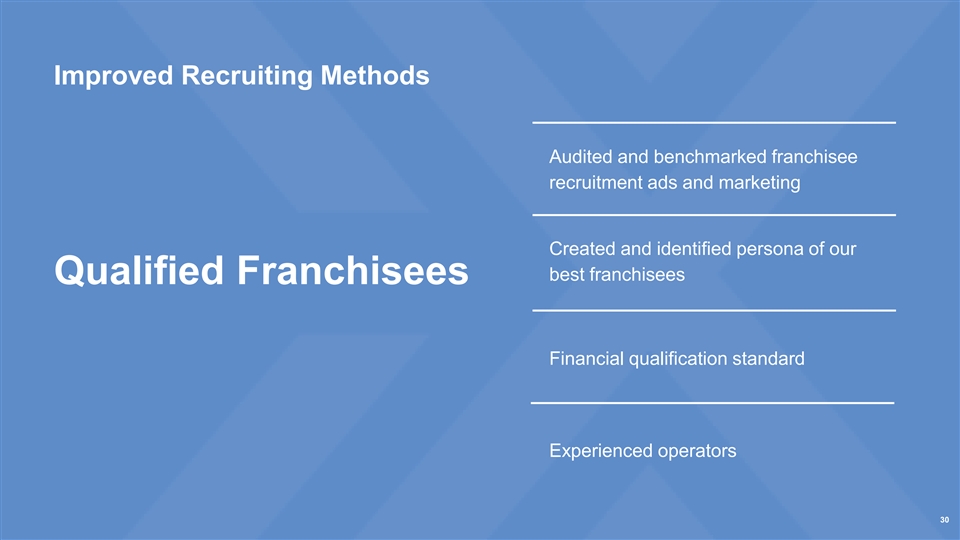
Improved Recruiting Methods Audited and benchmarked franchisee recruitment ads and marketing Created and identified persona of our best franchisees Qualified Franchisees Financial qualification standard Experienced operators 30

Opening Process Site Selection Onboarding Successful Launch 31
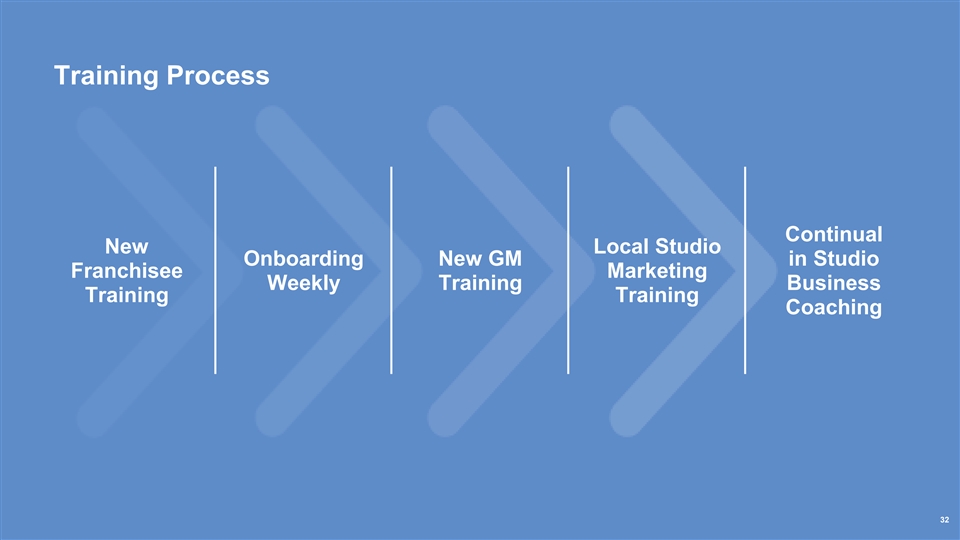
Training Process Continual New Local Studio Onboarding New GM in Studio Franchisee Marketing Weekly Training Business Training Training Coaching 32
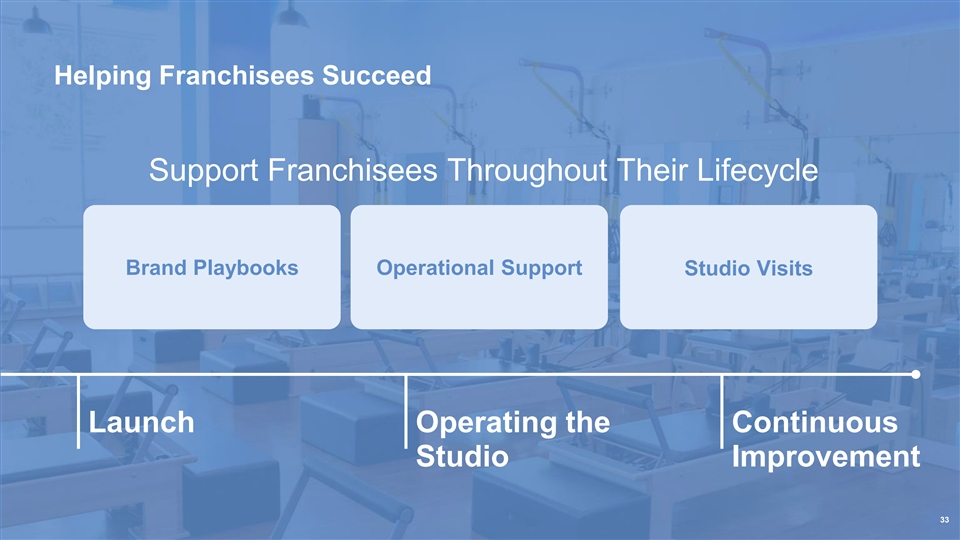
Helping Franchisees Succeed Support Franchisees Throughout Their Lifecycle Brand Playbooks Operational Support Studio Visits Launch Operating the Continuous Studio Improvement 33
Creating a Positive Xponential Feedback Loop Member Field Operations Where We Will Be Franchisee Franchisee Advisory Council 34
Organizational Improvement & Productivity: More Culture Focus Areas With Less Productivity Process New Improvement Technology 35
Franchise Evolution: 4-Wall Profitability Where We Want To Be and Returns What We Are Changing Where We Are 36

JOHN President, North America KAWAJA 37
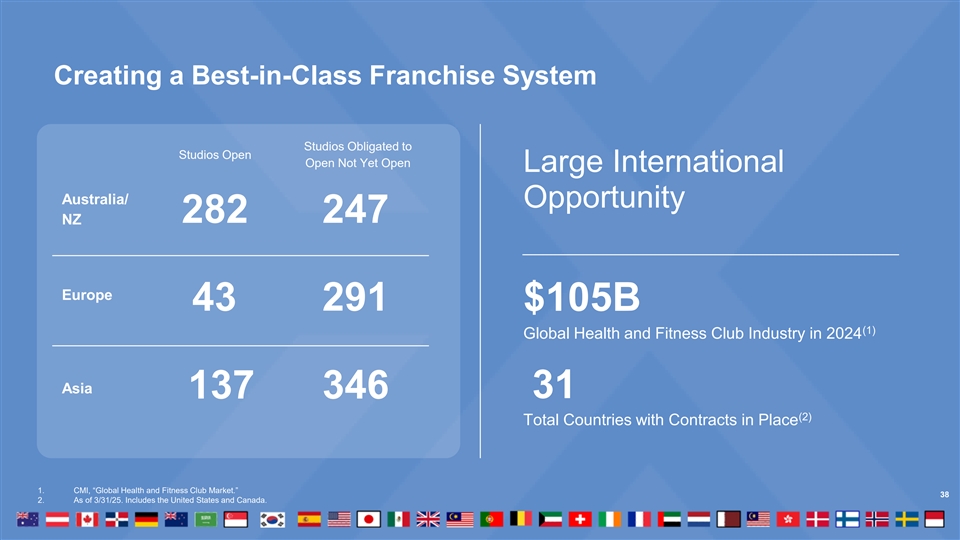
Creating a Best-in-Class Franchise System Studios Obligated to Studios Open Open Not Yet Open Large International Australia/ Opportunity 282 247 NZ Europe 43 291 $105B (1) Global Health and Fitness Club Industry in 2024 Asia 137 346 31 (2) Total Countries with Contracts in Place 1. CMI, “Global Health and Fitness Club Market.” 38 2. As of 3/31/25. Includes the United States and Canada.
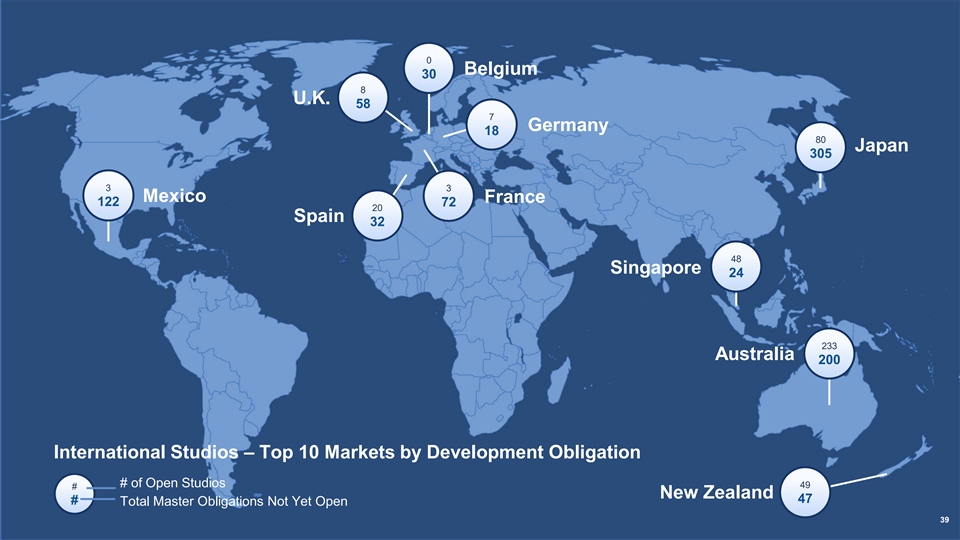
0 Belgium 30 8 U.K. 58 7 Germany 18 80 Japan 305 3 3 Mexico France 122 72 20 Spain 32 48 Singapore 24 233 Australia 200 International Studios – Top 10 Markets by Development Obligation # of Open Studios 49 # New Zealand 47 # Total Master Obligations Not Yet Open 39
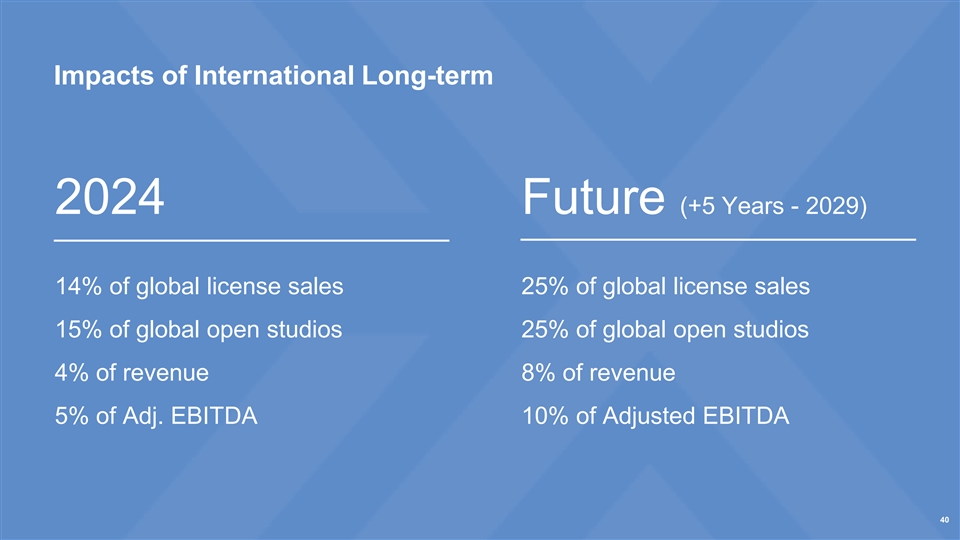
Impacts of International Long-term 2024 Future (+5 Years - 2029) 14% of global license sales 25% of global license sales 15% of global open studios 25% of global open studios 4% of revenue 8% of revenue 5% of Adj. EBITDA 10% of Adjusted EBITDA 40

JOHN Chief Financial Officer MELOUN 41
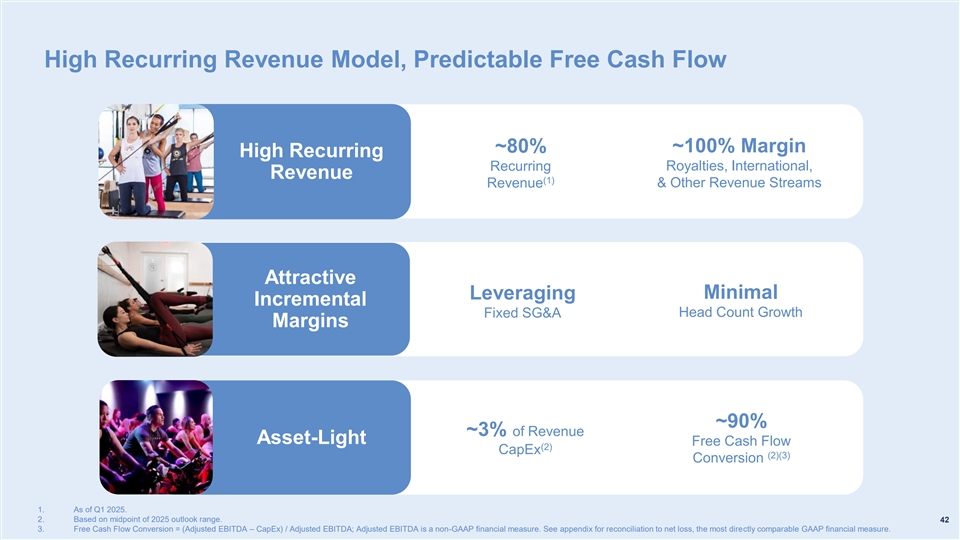
High Recurring Revenue Model, Predictable Free Cash Flow ~100% Margin ~80% High Recurring Recurring Royalties, International, Revenue (1) Revenue & Other Revenue Streams Attractive Minimal Leveraging Incremental Fixed SG&A Head Count Growth Margins ~90% ~3% of Revenue Asset-Light Free Cash Flow (2) CapEx (2)(3) Conversion 1. As of Q1 2025. 2. Based on midpoint of 2025 outlook range. 42 3. Free Cash Flow Conversion = (Adjusted EBITDA – CapEx) / Adjusted EBITDA; Adjusted EBITDA is a non-GAAP financial measure. See appendix for reconciliation to net loss, the most directly comparable GAAP financial measure.
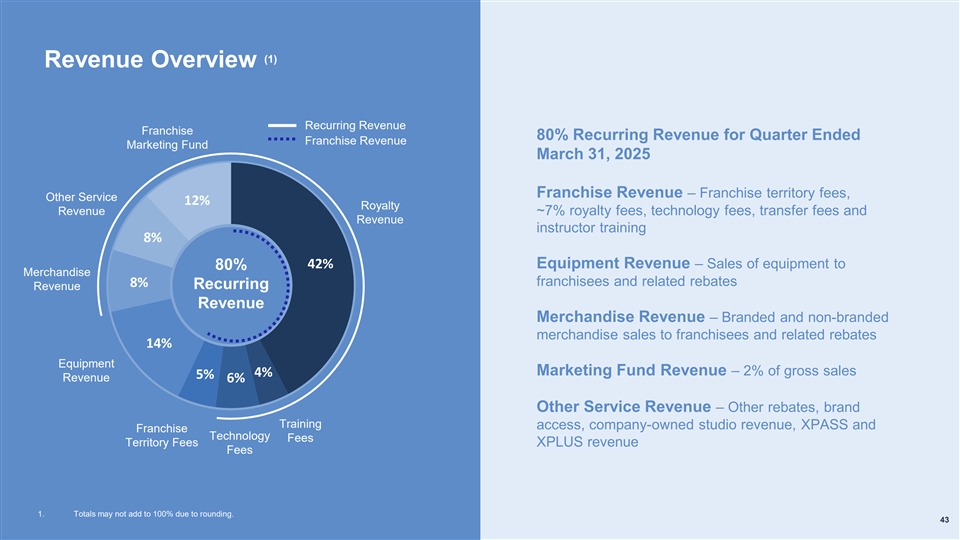
(1) Revenue Overview Recurring Revenue Franchise 80% Recurring Revenue for Quarter Ended Franchise Revenue Marketing Fund March 31, 2025 Franchise Revenue – Franchise territory fees, Other Service 12% Royalty Revenue ~7% royalty fees, technology fees, transfer fees and Revenue instructor training 8% 42% Equipment Revenue – Sales of equipment to 80% Merchandise 8% franchisees and related rebates Recurring Revenue Revenue Merchandise Revenue – Branded and non-branded merchandise sales to franchisees and related rebates 14% Equipment Marketing Fund Revenue – 2% of gross sales 4% 5% Revenue 6% Other Service Revenue – Other rebates, brand Training access, company-owned studio revenue, XPASS and Franchise Technology Fees Territory Fees XPLUS revenue Fees 1. Totals may not add to 100% due to rounding. 43
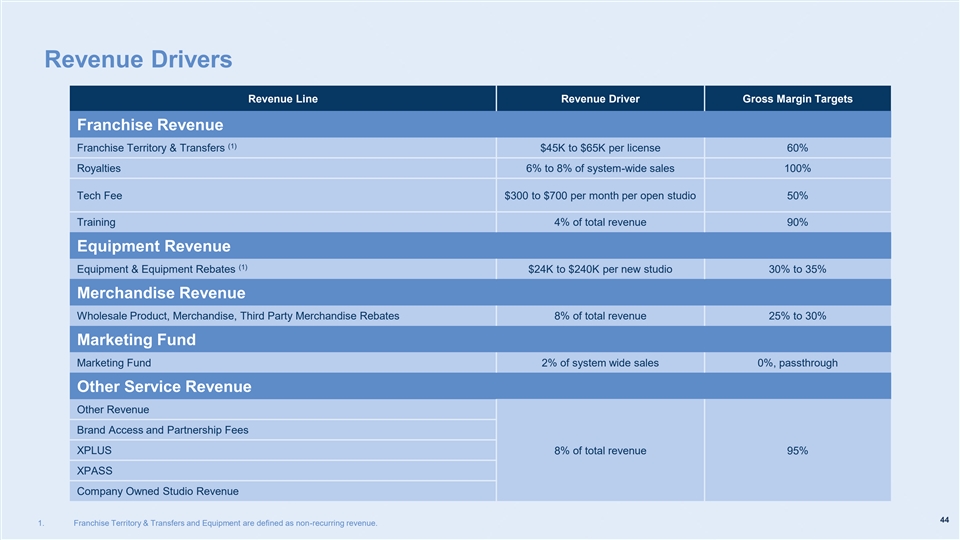
Revenue Drivers Revenue Line Revenue Driver Gross Margin Targets Franchise Revenue (1) Franchise Territory & Transfers $45K to $65K per license 60% Royalties 6% to 8% of system-wide sales 100% Tech Fee $300 to $700 per month per open studio 50% Training 4% of total revenue 90% Equipment Revenue (1) Equipment & Equipment Rebates $24K to $240K per new studio 30% to 35% Merchandise Revenue Wholesale Product, Merchandise, Third Party Merchandise Rebates 8% of total revenue 25% to 30% Marketing Fund Marketing Fund 2% of system wide sales 0%, passthrough Other Service Revenue Other Revenue Brand Access and Partnership Fees XPLUS 8% of total revenue 95% XPASS Company Owned Studio Revenue 44 1. Franchise Territory & Transfers and Equipment are defined as non-recurring revenue.
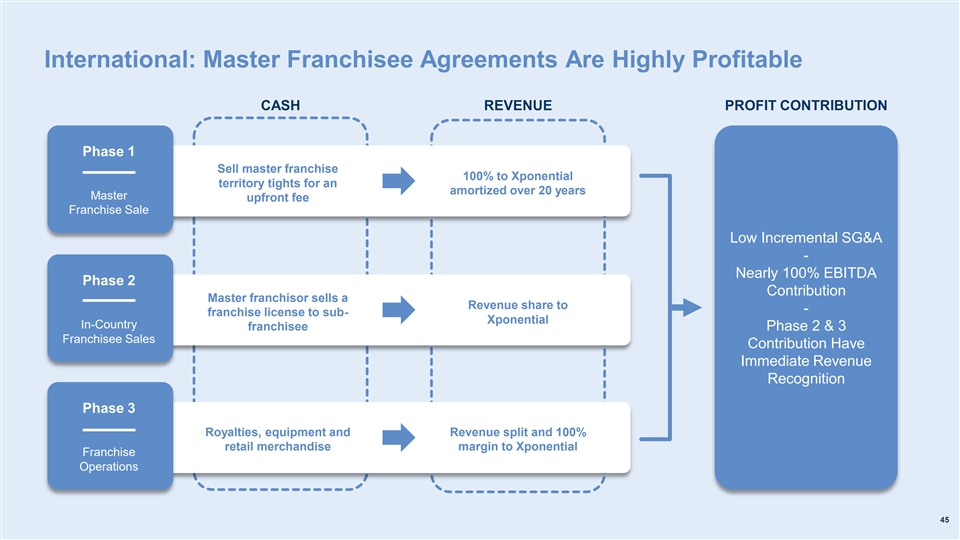
International: Master Franchisee Agreements Are Highly Profitable CASH REVENUE PROFIT CONTRIBUTION Phase 1 Sell master franchise 100% to Xponential territory tights for an amortized over 20 years Master upfront fee Franchise Sale Low Incremental SG&A - Nearly 100% EBITDA Phase 2 Contribution Master franchisor sells a Revenue share to - franchise license to sub- Xponential In-Country franchisee Phase 2 & 3 Franchisee Sales Contribution Have Immediate Revenue Recognition Phase 3 Royalties, equipment and Revenue split and 100% retail merchandise margin to Xponential Franchise Operations 45
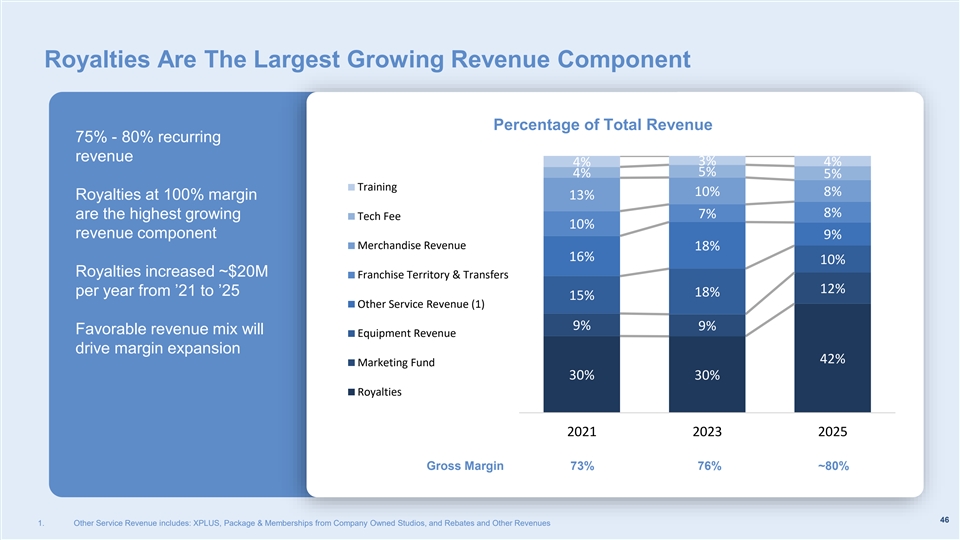
Royalties Are The Largest Growing Revenue Component Percentage of Total Revenue 75% - 80% recurring revenue 3% 4% 4% 5% 4% 5% Training 10% 8% Royalties at 100% margin 13% 8% are the highest growing 7% Tech Fee 10% revenue component 9% Merchandise Revenue 18% 16% 10% Royalties increased ~$20M Franchise Territory & Transfers 12% per year from ’21 to ’25 18% 15% Other Service Revenue (1) 9% 9% Favorable revenue mix will Equipment Revenue drive margin expansion 42% Marketing Fund 30% 30% Royalties 2021 2023 2025 Gross Margin 73% 76% ~80% 46 1. Other Service Revenue includes: XPLUS, Package & Memberships from Company Owned Studios, and Rebates and Other Revenues
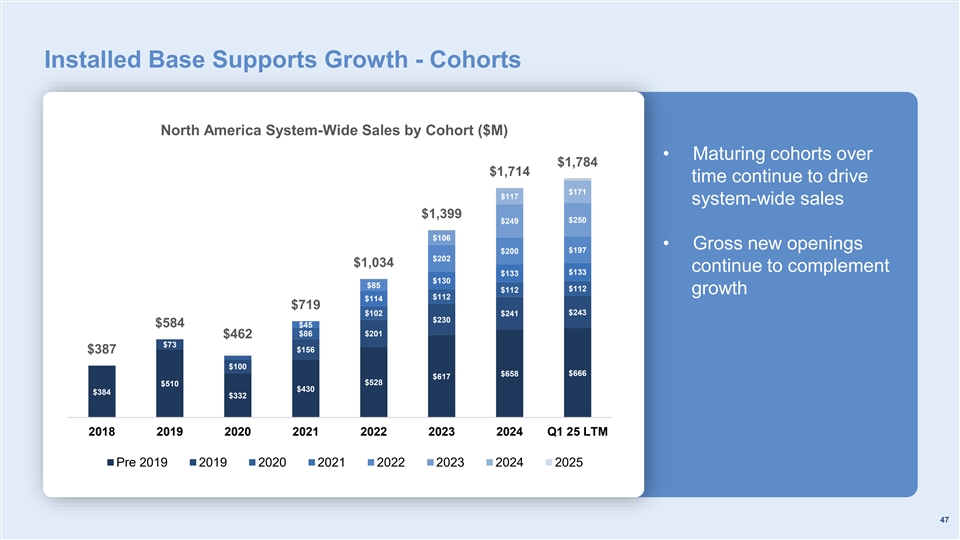
Installed Base Supports Growth - Cohorts North America System-Wide Sales by Cohort ($M) • Maturing cohorts over $1,784 $1,714 time continue to drive $171 $117 system-wide sales $1,399 $250 $249 $106 • Gross new openings $197 $200 $202 $1,034 continue to complement $133 $133 $130 $85 $112 $112 growth $112 $114 $719 $102 $241 $243 $230 $584 $45 $86 $201 $462 $73 $387 $156 $28 $100 $666 $658 $617 $528 $510 $430 $384 $332 2018 2019 2020 2021 2022 2023 2024 Q1 25 LTM Pre 2019 2019 2020 2021 2022 2023 2024 2025 47
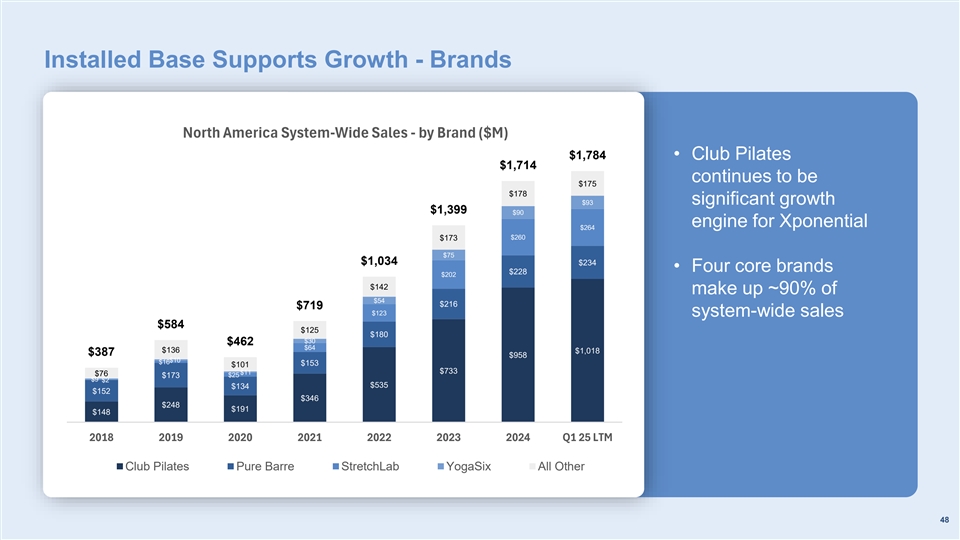
Installed Base Supports Growth - Brands North America System-Wide Sales - by Brand ($M) $1,784 • Club Pilates $1,714 continues to be $175 $178 $93 significant growth $1,399 $90 engine for Xponential $264 $260 $173 $75 $1,034 $234 • Four core brands $228 $202 $142 make up ~90% of $54 $216 $719 $123 system-wide sales $584 $125 $180 $30 $462 $64 $136 $1,018 $387 $958 $10 $16 $153 $101 $733 $11 $76 $25 $173 $9 $2 $535 $134 $152 $346 $248 $191 $148 2018 2019 2020 2021 2022 2023 2024 Q1 25 LTM Club Pilates Pure Barre StretchLab YogaSix All Other 48
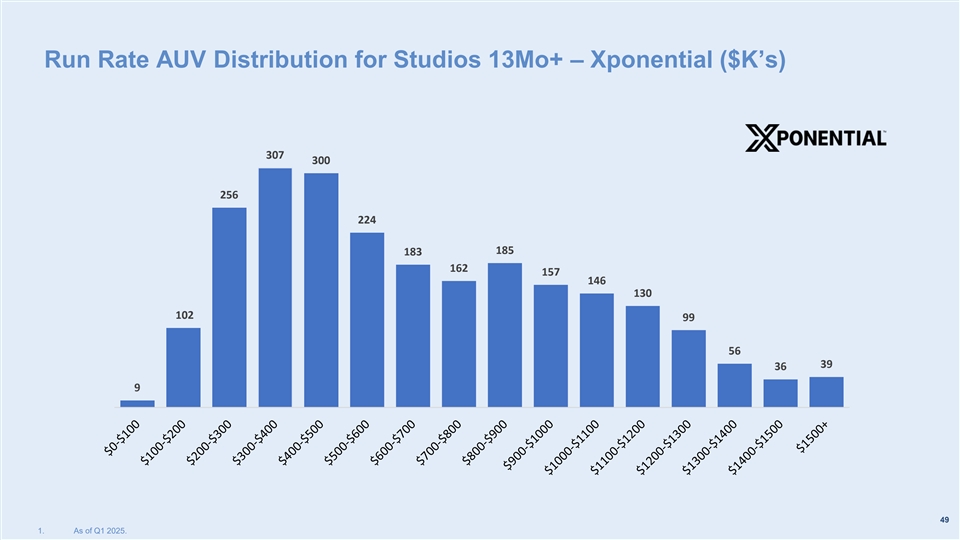
Run Rate AUV Distribution for Studios 13Mo+ – Xponential ($K’s) 307 300 256 224 185 183 162 157 146 130 102 99 56 39 36 9 49 1. As of Q1 2025.
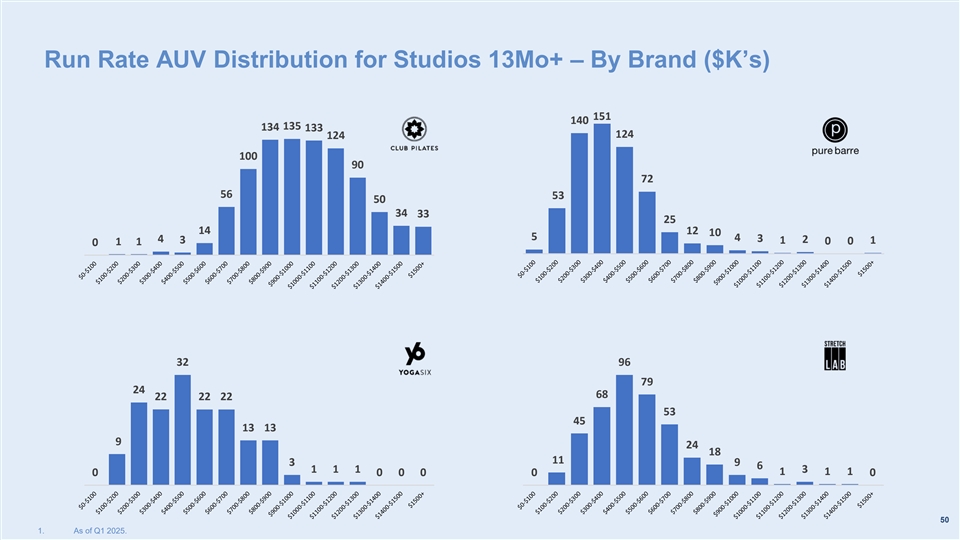
Run Rate AUV Distribution for Studios 13Mo+ – By Brand ($K’s) 151 140 135 134 133 124 124 100 90 72 56 53 50 34 33 25 14 12 10 5 4 4 3 2 3 1 1 1 1 0 0 0 32 96 79 24 68 22 22 22 53 45 13 13 9 24 18 11 3 9 6 1 1 1 3 1 1 1 0 0 0 0 0 0 50 1. As of Q1 2025.
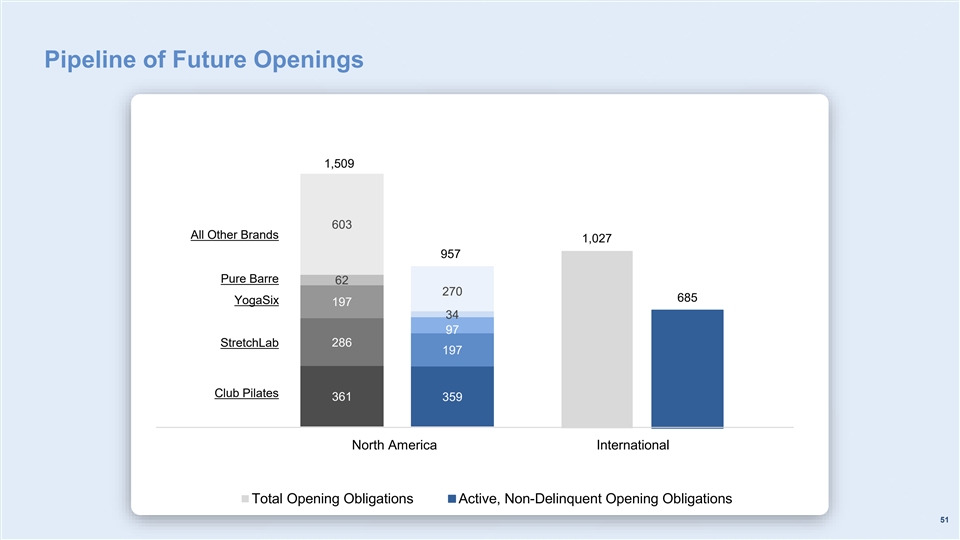
Pipeline of Future Openings 1,509 603 All Other Brands 1,027 All Other Brands 957 957 Pure Barre Pure Barre 62 270 YogaSix 685 YogaSix 197 StretchLab 34 97 Club Pilates StretchLab 286 197 Club Pilates 361 359 North America International Total Opening Obligations Active, Non-Delinquent Opening Obligations 51
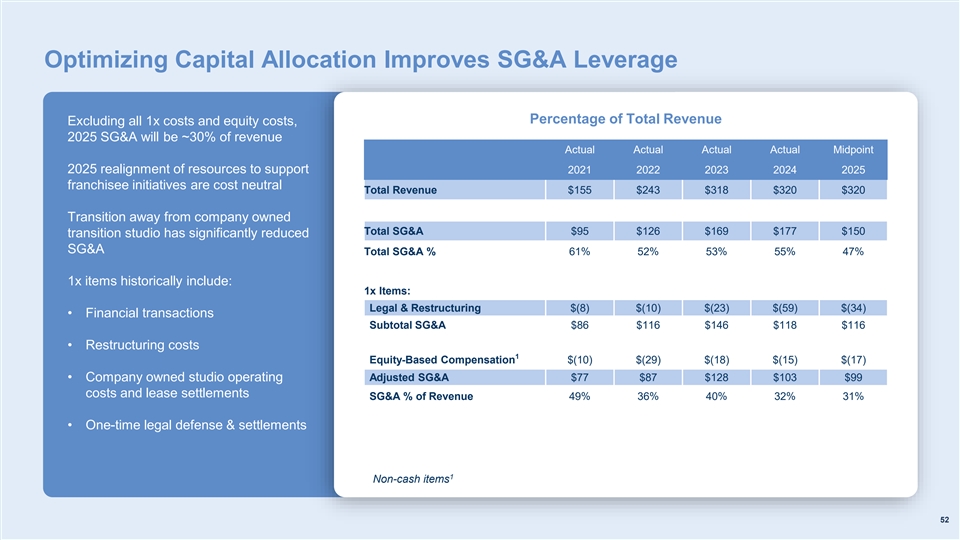
Optimizing Capital Allocation Improves SG&A Leverage Percentage of Total Revenue Excluding all 1x costs and equity costs, 2025 SG&A will be ~30% of revenue Actual Actual Actual Actual Midpoint 2025 realignment of resources to support 2021 2022 2023 2024 2025 franchisee initiatives are cost neutral Total Revenue $155 $243 $318 $320 $320 Transition away from company owned Total SG&A $95 $126 $169 $177 $150 transition studio has significantly reduced SG&A Total SG&A % 61% 52% 53% 55% 47% 1x items historically include: 1x Items: Legal & Restructuring $(8) $(10) $(23) $(59) $(34) • Financial transactions Subtotal SG&A $86 $116 $146 $118 $116 • Restructuring costs 1 Equity-Based Compensation $(10) $(29) $(18) $(15) $(17) • Company owned studio operating Adjusted SG&A $77 $87 $128 $103 $99 costs and lease settlements SG&A % of Revenue 49% 36% 40% 32% 31% • One-time legal defense & settlements 1 Non-cash items 52
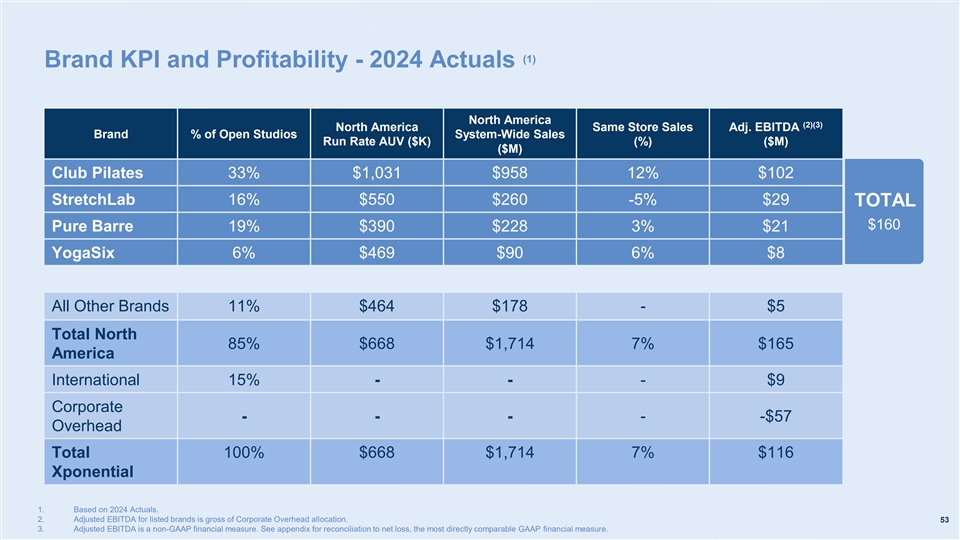
(1) Brand KPI and Profitability - 2024 Actuals North America (2)(3) North America Same Store Sales Adj. EBITDA Brand % of Open Studios System-Wide Sales Run Rate AUV ($K) (%) ($M) ($M) Club Pilates 33% $1,031 $958 12% $102 StretchLab 16% $550 $260 -5% $29 TOTAL $160 Pure Barre 19% $390 $228 3% $21 YogaSix 6% $469 $90 6% $8 All Other Brands 11% $464 $178 - $5 Total North 85% $668 $1,714 7% $165 America International 15% - - - $9 Corporate - - - - -$57 Overhead Total 100% $668 $1,714 7% $116 Xponential 1. Based on 2024 Actuals. 2. Adjusted EBITDA for listed brands is gross of Corporate Overhead allocation. 53 3. Adjusted EBITDA is a non-GAAP financial measure. See appendix for reconciliation to net loss, the most directly comparable GAAP financial measure.
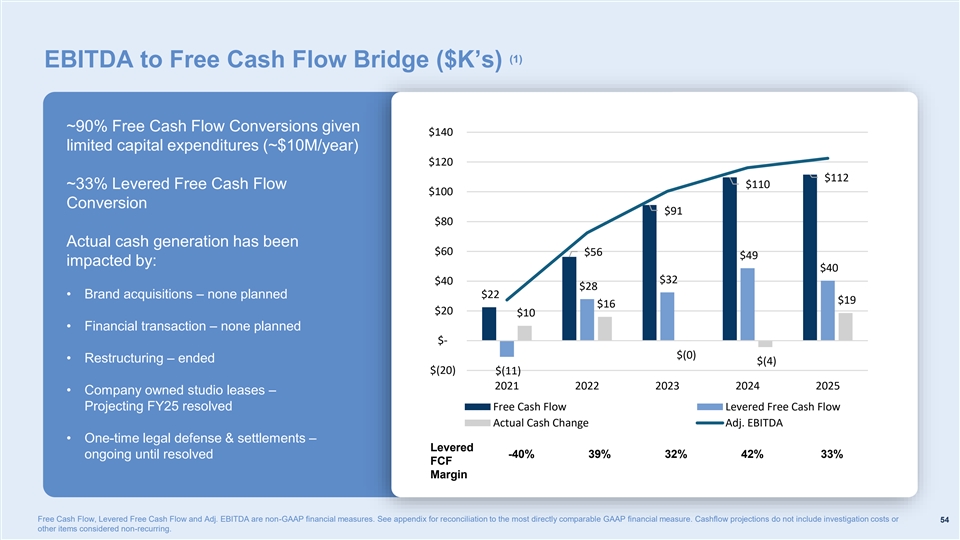
(1) EBITDA to Free Cash Flow Bridge ($K’s) ~90% Free Cash Flow Conversions given $140 limited capital expenditures (~$10M/year) $120 $112 $110 ~33% Levered Free Cash Flow $100 Conversion $91 $80 Actual cash generation has been $60 $56 $49 impacted by: $40 $32 $40 $28 • Brand acquisitions – none planned $22 $19 $16 $20 $10 • Financial transaction – none planned $- $(0) • Restructuring – ended $(4) $(20) $(11) 2021 2022 2023 2024 2025 • Company owned studio leases – Projecting FY25 resolved Free Cash Flow Levered Free Cash Flow Actual Cash Change Adj. EBITDA • One-time legal defense & settlements – Levered ongoing until resolved -40% 39% 32% 42% 33% FCF Margin Free Cash Flow, Levered Free Cash Flow and Adj. EBITDA are non-GAAP financial measures. See appendix for reconciliation to the most directly comparable GAAP financial measure. Cashflow projections do not include investigation costs or 54 other items considered non-recurring.
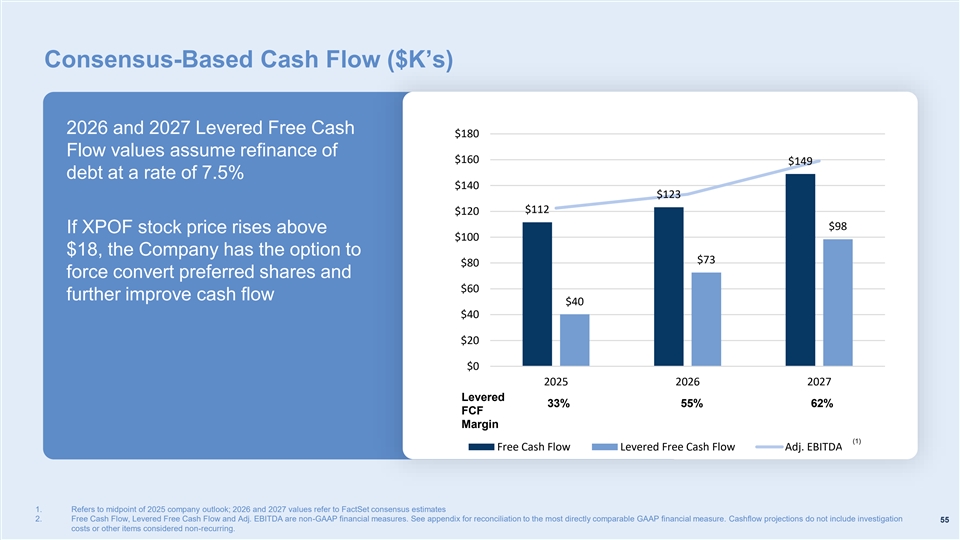
Consensus-Based Cash Flow ($K’s) 2026 and 2027 Levered Free Cash $180 Flow values assume refinance of $160 $149 debt at a rate of 7.5% $140 $123 $112 $120 $98 If XPOF stock price rises above $100 $18, the Company has the option to $73 $80 force convert preferred shares and $60 further improve cash flow $40 $40 $20 $0 2025 2026 2027 Levered 33% 55% 62% FCF Margin (1) Free Cash Flow Levered Free Cash Flow Adj. EBITDA(1) 1. Refers to midpoint of 2025 company outlook; 2026 and 2027 values refer to FactSet consensus estimates 2. Free Cash Flow, Levered Free Cash Flow and Adj. EBITDA are non-GAAP financial measures. See appendix for reconciliation to the most directly comparable GAAP financial measure. Cashflow projections do not include investigation 55 costs or other items considered non-recurring.
Capital Structure: Allocating Capital to Drive Predictable Profitable Growth Organic M&A Debt Share Repurchases Growth Opportunities Paydown / Dividends 56
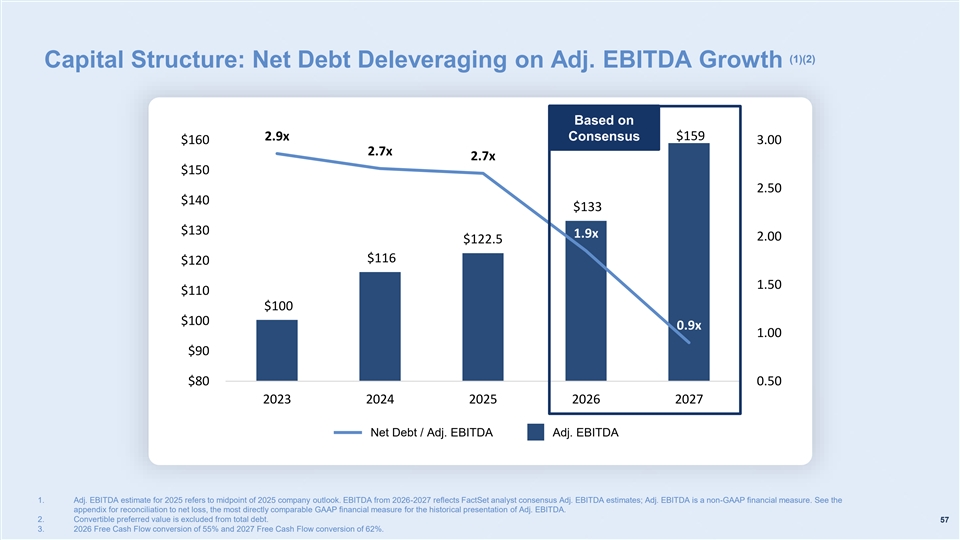
(1)(2) Capital Structure: Net Debt Deleveraging on Adj. EBITDA Growth Based on $159 2.9x Consensus $160 3.00 2.7x 2.7x $150 2.50 $140 $133 $130 1.9x 2.00 $122.5 $116 $120 1.50 $110 $100 $100 0.9x 1.00 $90 $80 0.50 2023 2024 2025 2026 2027 Net Debt / Adj. EBITDA Adj. EBITDA 1. Adj. EBITDA estimate for 2025 refers to midpoint of 2025 company outlook. EBITDA from 2026-2027 reflects FactSet analyst consensus Adj. EBITDA estimates; Adj. EBITDA is a non-GAAP financial measure. See the appendix for reconciliation to net loss, the most directly comparable GAAP financial measure for the historical presentation of Adj. EBITDA. 2. Convertible preferred value is excluded from total debt. 57 3. 2026 Free Cash Flow conversion of 55% and 2027 Free Cash Flow conversion of 62%.
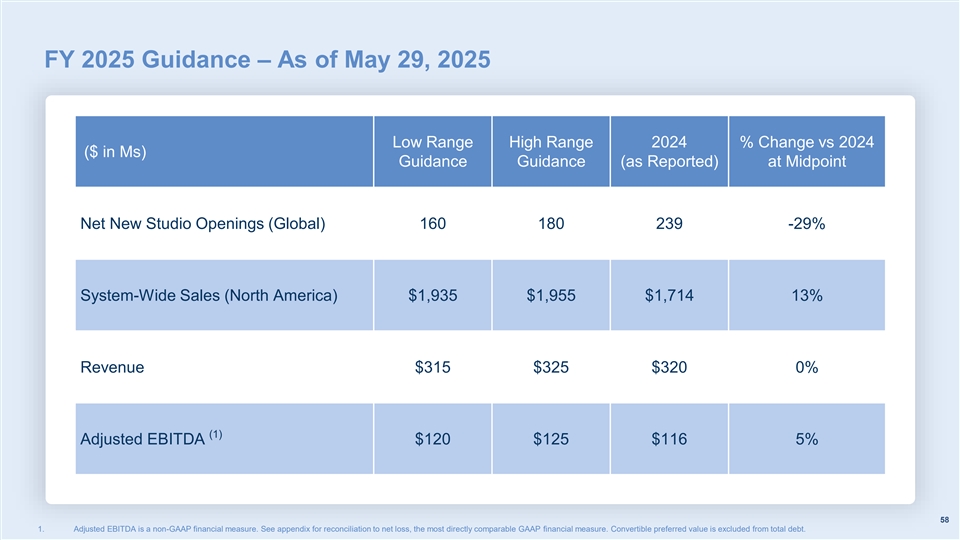
FY 2025 Guidance – As of May 29, 2025 Low Range High Range 2024 % Change vs 2024 ($ in Ms) Guidance Guidance (as Reported) at Midpoint Net New Studio Openings (Global) 160 180 239 -29% System-Wide Sales (North America) $1,935 $1,955 $1,714 13% Revenue $315 $325 $320 0% (1) Adjusted EBITDA $120 $125 $116 5% 58 1. Adjusted EBITDA is a non-GAAP financial measure. See appendix for reconciliation to net loss, the most directly comparable GAAP financial measure. Convertible preferred value is excluded from total debt.
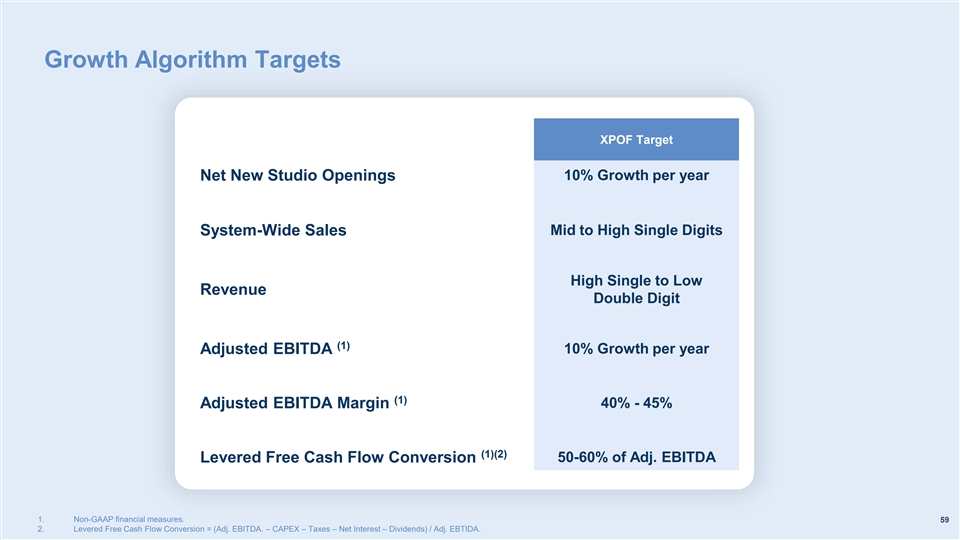
Growth Algorithm Targets XPOF Target 10% Growth per year Net New Studio Openings Mid to High Single Digits System-Wide Sales High Single to Low Revenue Double Digit (1) 10% Growth per year Adjusted EBITDA (1) Adjusted EBITDA Margin 40% - 45% (1)(2) Levered Free Cash Flow Conversion 50-60% of Adj. EBITDA 1. Non-GAAP financial measures. 59 2. Levered Free Cash Flow Conversion = (Adj. EBITDA. – CAPEX – Taxes – Net Interest – Dividends) / Adj. EBTIDA.
Dynamic, Predictable, Profitable Growth Strong Revenue, AUV and System-Wide Sales Growth Predictable Studio Openings Increasing Profitability Solid Market Position Cash Flow Positive 60

Appendix 61
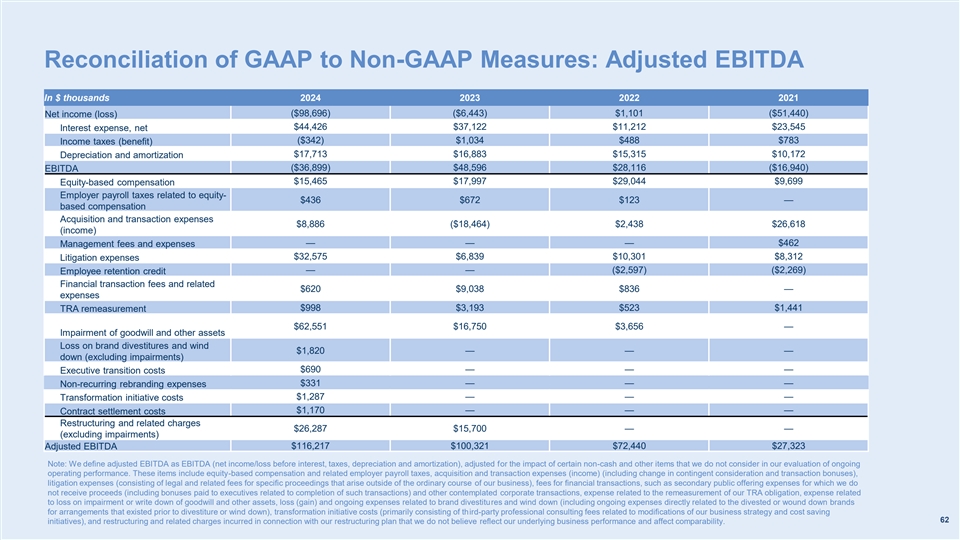
Reconciliation of GAAP to Non-GAAP Measures: Adjusted EBITDA In $ thousands 2024 2023 2022 2021 ($98,696) ($6,443) $1,101 ($51,440) Net income (loss) Interest expense, net $44,426 $37,122 $11,212 $23,545 ($342) $1,034 $488 $783 Income taxes (benefit) $17,713 $16,883 $15,315 $10,172 Depreciation and amortization ($36,899) $48,596 $28,116 ($16,940) EBITDA $15,465 $17,997 $29,044 $9,699 Equity-based compensation Employer payroll taxes related to equity- $436 $672 $123 — based compensation Acquisition and transaction expenses $8,886 ($18,464) $2,438 $26,618 (income) — — — $462 Management fees and expenses $32,575 $6,839 $10,301 $8,312 Litigation expenses — — ($2,597) ($2,269) Employee retention credit Financial transaction fees and related $620 $9,038 $836 — expenses $998 $3,193 $523 $1,441 TRA remeasurement $62,551 $16,750 $3,656 — Impairment of goodwill and other assets Loss on brand divestitures and wind $1,820 — — — down (excluding impairments) Executive transition costs $690 — — — $331 — — — Non-recurring rebranding expenses $1,287 — — — Transformation initiative costs $1,170 — — — Contract settlement costs Restructuring and related charges $26,287 $15,700 — — (excluding impairments) Adjusted EBITDA $116,217 $100,321 $72,440 $27,323 Note: We define adjusted EBITDA as EBITDA (net income/loss before interest, taxes, depreciation and amortization), adjusted for the impact of certain non-cash and other items that we do not consider in our evaluation of ongoing operating performance. These items include equity-based compensation and related employer payroll taxes, acquisition and transaction expenses (income) (including change in contingent consideration and transaction bonuses), litigation expenses (consisting of legal and related fees for specific proceedings that arise outside of the ordinary course of our business), fees for financial transactions, such as secondary public offering expenses for which we do not receive proceeds (including bonuses paid to executives related to completion of such transactions) and other contemplated corporate transactions, expense related to the remeasurement of our TRA obligation, expense related to loss on impairment or write down of goodwill and other assets, loss (gain) and ongoing expenses related to brand divestitures and wind down (including ongoing expenses directly related to the divested or wound down brands for arrangements that existed prior to divestiture or wind down), transformation initiative costs (primarily consisting of third-party professional consulting fees related to modifications of our business strategy and cost saving 62 initiatives), and restructuring and related charges incurred in connection with our restructuring plan that we do not believe reflect our underlying business performance and affect comparability.
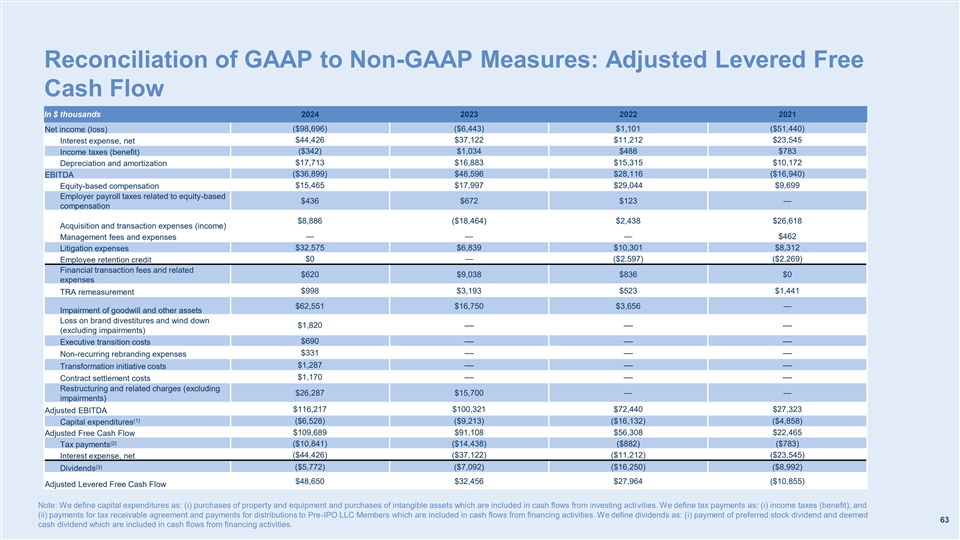
Reconciliation of GAAP to Non-GAAP Measures: Adjusted Levered Free Cash Flow In $ thousands 2024 2023 2022 2021 Net income (loss) ($98,696) ($6,443) $1,101 ($51,440) $44,426 $37,122 $11,212 $23,545 Interest expense, net Income taxes (benefit) ($342) $1,034 $488 $783 $17,713 $16,883 $15,315 $10,172 Depreciation and amortization EBITDA ($36,899) $48,596 $28,116 ($16,940) $15,465 $17,997 $29,044 $9,699 Equity-based compensation Employer payroll taxes related to equity-based $436 $672 $123 — compensation $8,886 ($18,464) $2,438 $26,618 Acquisition and transaction expenses (income) — — — $462 Management fees and expenses $32,575 $6,839 $10,301 $8,312 Litigation expenses $0 — ($2,597) ($2,269) Employee retention credit Financial transaction fees and related $620 $9,038 $836 $0 expenses $998 $3,193 $523 $1,441 TRA remeasurement $62,551 $16,750 $3,656 — Impairment of goodwill and other assets Loss on brand divestitures and wind down $1,820 — — — (excluding impairments) $690 — — — Executive transition costs $331 — — — Non-recurring rebranding expenses $1,287 — — — Transformation initiative costs $1,170 — — — Contract settlement costs Restructuring and related charges (excluding $26,287 $15,700 — — impairments) $116,217 $100,321 $72,440 $27,323 Adjusted EBITDA (1) ($6,528) ($9,213) ($16,132) ($4,858) Capital expenditures Adjusted Free Cash Flow $109,689 $91,108 $56,308 $22,465 (2) ($10,841) ($14,438) ($882) ($783) Tax payments Interest expense, net ($44,426) ($37,122) ($11,212) ($23,545) (3) ($5,772) ($7,092) ($16,250) ($8,992) Dividends $48,650 $32,456 $27,964 ($10,855) Adjusted Levered Free Cash Flow Note: We define capital expenditures as: (i) purchases of property and equipment and purchases of intangible assets which are included in cash flows from investing activities. We define tax payments as: (i) income taxes (benefit), and (ii) payments for tax receivable agreement and payments for distributions to Pre-IPO LLC Members which are included in cash flows from financing activities. We define dividends as: (i) payment of preferred stock dividend and deemed 63 cash dividend which are included in cash flows from financing activities.