Exhibit 99.1 INVESTOR PRESENTATION As of Q2 2021 Updated: September 10, 2021 N Y S E : X P O F | X P O N E N T I A L F I T N E S S 1Exhibit 99.1 INVESTOR PRESENTATION As of Q2 2021 Updated: September 10, 2021 N Y S E : X P O F | X P O N E N T I A L F I T N E S S 1
LEGAL DISCLAIMER The information contained in this presentation is provided solely for the purpose of acquainting the readers with Xponential Fitness, Inc. (the “Company,” “Xponential” or “we”) and its business operations, strategies and financial performance. This presentation and any accompanying oral statements is not an offer to sell nor is it a solicitation of any offer to buy any securities and conveys no right, title or interest in the Company or the products of its business activities. The information contained herein is confidential and strictly proprietary. By accepting this document, the recipient agrees not to reproduce its contents nor disclose or distribute same to any person or entity without the expressed prior consent of the company. This presentation does not purport to be all-inclusive or to contain all of the information you or any prospective investor may desire. Cautionary Note Regarding Forward-Looking Statements This presentation contains forward-looking statements that involve substantial risks and uncertainties. Any statements contained in this presentation that are not statements of historical facts may be deemed to be forward-looking statements. These forward-looking statements include, without limitation, statements relating to key strategies for growth; the projected number of studio opened; expansion of market share and international business operations; the rollout of XPASS; projected financial and performance information such as studio opening, system-wide sales, annual revenue, Adjusted EBITDA; the expected trend in fitness industry; and the anticipated advantages of the franchise model. Forward-looking statements involve risks and uncertainties that may cause actual results to differ materially from those contained in the forward-looking statements. These factors include, but are not limited to, the impact of COVID-19 pandemic on our business and franchisees; our relationships with master franchisees and franchisees; difficulties and challenges in opening studios by franchisees; the ability of franchisees to generate sufficient revenues; risks relating to expansion into international market; loss or reputation and brand awareness; material weakness in our internal control over financial reporting; and other risks as described in our SEC filings, including our Quarterly Report on Form 10-Q for the three months ended June 30, 2021 filed with the SEC. Other unknown or unpredictable factors or underlying assumptions subsequently proving to be incorrect could cause actual results to differ materially from those in the forward-looking statements. Although we believe that the expectations reflected in the forward-looking statements are reasonable, we cannot guarantee future results, level of activity, performance, or achievements. You should not place undue reliance on these forward- looking statements. All information provided in this press release is as of today’s date, unless otherwise stated, and Xponential undertakes no duty to update such information, except as required under applicable law. Market Data and Non-GAAP Financial Measures This presentation includes statistical and other industry and market data that we obtained from industry publications and research, surveys, studies and other similar third-party sources, as well as our estimates based on such data and on our internal sources. Such data and estimates involve a number of assumptions and limitations, and you are cautioned not to give undue weight to such data and estimates. We believe that the information from these third-party sources is reliable; however, we have not independently verified them, we make no representation as to their accuracy or completeness and we do not undertake to update the data from such sources after the date of this presentation. Further, our business and the industry in which we operate is subject to a high degree of risk and uncertainty, which could cause results to differ materially from those expressed in the estimates made by the third-party sources and by us. We use certain non-GAAP financial information in this presentation, such as EBITDA and Adjusted EBITDA, to evaluate our ongoing operations and for internal planning and forecasting purposes. We believe that non-GAAP financial information, when taken collectively with comparable GAAP financial measures, is helpful to investors because it provides consistency and comparability with past financial performance, and provides meaningful supplemental information regarding our performance by excluding certain items that may not be indicative of our business, results of operations or outlook. However, non-GAAP financial information is presented for supplemental informational purposes only, has limitations as an analytical tool, and should not be considered in isolation or as a substitute for financial information presented in accordance with GAAP. In addition, other companies, including companies in our industry, may calculate similarly titled non-GAAP measures differently or may use other measures to evaluate their performance, all of which could reduce the usefulness of our non-GAAP financial measure as tools for comparison. We seek to compensate such limitations by providing a detailed reconciliation for the non-GAAP financial measures to the most directly comparable financial measures stated in accordance with GAAP in this presentation. You are encouraged to review the related GAAP financial measures and the reconciliation of the non-GAAP financial measures to their most directly comparable GAAP financial measures and not rely on any single financial measure to evaluate our business. N Y S E : X P O F | X P O N E N T I A L F I T N E S S 2LEGAL DISCLAIMER The information contained in this presentation is provided solely for the purpose of acquainting the readers with Xponential Fitness, Inc. (the “Company,” “Xponential” or “we”) and its business operations, strategies and financial performance. This presentation and any accompanying oral statements is not an offer to sell nor is it a solicitation of any offer to buy any securities and conveys no right, title or interest in the Company or the products of its business activities. The information contained herein is confidential and strictly proprietary. By accepting this document, the recipient agrees not to reproduce its contents nor disclose or distribute same to any person or entity without the expressed prior consent of the company. This presentation does not purport to be all-inclusive or to contain all of the information you or any prospective investor may desire. Cautionary Note Regarding Forward-Looking Statements This presentation contains forward-looking statements that involve substantial risks and uncertainties. Any statements contained in this presentation that are not statements of historical facts may be deemed to be forward-looking statements. These forward-looking statements include, without limitation, statements relating to key strategies for growth; the projected number of studio opened; expansion of market share and international business operations; the rollout of XPASS; projected financial and performance information such as studio opening, system-wide sales, annual revenue, Adjusted EBITDA; the expected trend in fitness industry; and the anticipated advantages of the franchise model. Forward-looking statements involve risks and uncertainties that may cause actual results to differ materially from those contained in the forward-looking statements. These factors include, but are not limited to, the impact of COVID-19 pandemic on our business and franchisees; our relationships with master franchisees and franchisees; difficulties and challenges in opening studios by franchisees; the ability of franchisees to generate sufficient revenues; risks relating to expansion into international market; loss or reputation and brand awareness; material weakness in our internal control over financial reporting; and other risks as described in our SEC filings, including our Quarterly Report on Form 10-Q for the three months ended June 30, 2021 filed with the SEC. Other unknown or unpredictable factors or underlying assumptions subsequently proving to be incorrect could cause actual results to differ materially from those in the forward-looking statements. Although we believe that the expectations reflected in the forward-looking statements are reasonable, we cannot guarantee future results, level of activity, performance, or achievements. You should not place undue reliance on these forward- looking statements. All information provided in this press release is as of today’s date, unless otherwise stated, and Xponential undertakes no duty to update such information, except as required under applicable law. Market Data and Non-GAAP Financial Measures This presentation includes statistical and other industry and market data that we obtained from industry publications and research, surveys, studies and other similar third-party sources, as well as our estimates based on such data and on our internal sources. Such data and estimates involve a number of assumptions and limitations, and you are cautioned not to give undue weight to such data and estimates. We believe that the information from these third-party sources is reliable; however, we have not independently verified them, we make no representation as to their accuracy or completeness and we do not undertake to update the data from such sources after the date of this presentation. Further, our business and the industry in which we operate is subject to a high degree of risk and uncertainty, which could cause results to differ materially from those expressed in the estimates made by the third-party sources and by us. We use certain non-GAAP financial information in this presentation, such as EBITDA and Adjusted EBITDA, to evaluate our ongoing operations and for internal planning and forecasting purposes. We believe that non-GAAP financial information, when taken collectively with comparable GAAP financial measures, is helpful to investors because it provides consistency and comparability with past financial performance, and provides meaningful supplemental information regarding our performance by excluding certain items that may not be indicative of our business, results of operations or outlook. However, non-GAAP financial information is presented for supplemental informational purposes only, has limitations as an analytical tool, and should not be considered in isolation or as a substitute for financial information presented in accordance with GAAP. In addition, other companies, including companies in our industry, may calculate similarly titled non-GAAP measures differently or may use other measures to evaluate their performance, all of which could reduce the usefulness of our non-GAAP financial measure as tools for comparison. We seek to compensate such limitations by providing a detailed reconciliation for the non-GAAP financial measures to the most directly comparable financial measures stated in accordance with GAAP in this presentation. You are encouraged to review the related GAAP financial measures and the reconciliation of the non-GAAP financial measures to their most directly comparable GAAP financial measures and not rely on any single financial measure to evaluate our business. N Y S E : X P O F | X P O N E N T I A L F I T N E S S 2
Our Mission is to Make Boutique Fitness Accessible to Everyone N Y S E : X P O F | X P O N E N T I A L F I T N E S S 3Our Mission is to Make Boutique Fitness Accessible to Everyone N Y S E : X P O F | X P O N E N T I A L F I T N E S S 3
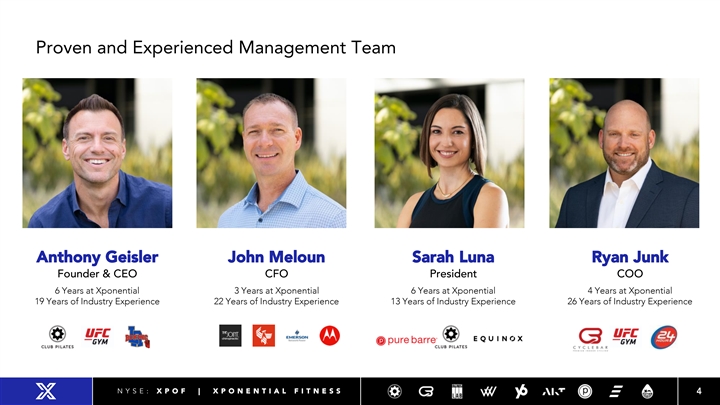
Proven and Experienced Management Team Anthony Geisler John Meloun Sarah Luna Ryan Junk Founder & CEO CFO President COO 6 Years at Xponential 3 Years at Xponential 6 Years at Xponential 4 Years at Xponential 19 Years of Industry Experience 22 Years of Industry Experience 13 Years of Industry Experience 26 Years of Industry Experience N Y S E : X P O F | X P O N E N T I A L F I T N E S S 4Proven and Experienced Management Team Anthony Geisler John Meloun Sarah Luna Ryan Junk Founder & CEO CFO President COO 6 Years at Xponential 3 Years at Xponential 6 Years at Xponential 4 Years at Xponential 19 Years of Industry Experience 22 Years of Industry Experience 13 Years of Industry Experience 26 Years of Industry Experience N Y S E : X P O F | X P O N E N T I A L F I T N E S S 4
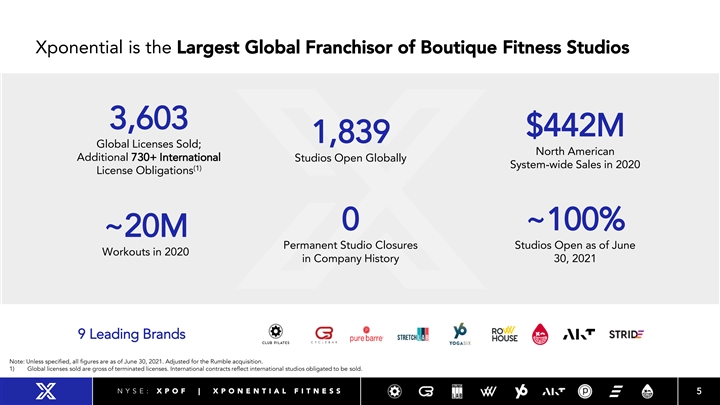
Xponential is the Largest Global Franchisor of Boutique Fitness Studios 3,603 $442M 1,839 Global Licenses Sold; North American Additional 730+ International Studios Open Globally System-wide Sales in 2020 (1) License Obligations 0 ~100% ~20M Permanent Studio Closures Studios Open as of June Workouts in 2020 in Company History 30, 2021 9 Leading Brands Note: Unless specified, all figures are as of June 30, 2021. Adjusted for the Rumble acquisition. 1) Global licenses sold are gross of terminated licenses. International contracts reflect international studios obligated to be sold. N Y S E : X P O F | X P O N E N T I A L F I T N E S S 5Xponential is the Largest Global Franchisor of Boutique Fitness Studios 3,603 $442M 1,839 Global Licenses Sold; North American Additional 730+ International Studios Open Globally System-wide Sales in 2020 (1) License Obligations 0 ~100% ~20M Permanent Studio Closures Studios Open as of June Workouts in 2020 in Company History 30, 2021 9 Leading Brands Note: Unless specified, all figures are as of June 30, 2021. Adjusted for the Rumble acquisition. 1) Global licenses sold are gross of terminated licenses. International contracts reflect international studios obligated to be sold. N Y S E : X P O F | X P O N E N T I A L F I T N E S S 5
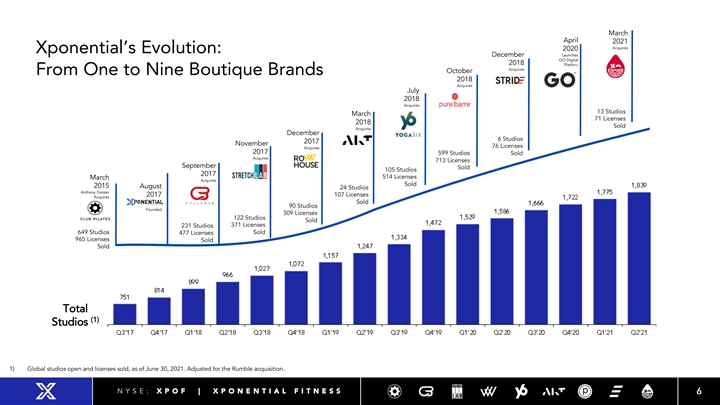
March April 2021 Acquires 2020 Xponential’s Evolution: December Launches GO Digital 2018 Platform Acquires October From One to Nine Boutique Brands 2018 Acquires July 2018 Acquires 13 Studios March 71 Licenses 2018 Sold Acquires December 6 Studios 2017 November 76 Licenses Acquires 2017 599 Studios Sold Acquires 713 Licenses September Sold 105 Studios 2017 514 Licenses March Acquires Sold 2015 August 24 Studios Anthony Geisler 2017 107 Licenses Acquires Sold 90 Studios Founded 309 Licenses 122 Studios Sold 371 Licenses 231 Studios 649 Studios Sold 477 Licenses 965 Licenses Sold Sold Total (1) Studios 1) Global studios open and licenses sold, as of June 30, 2021. Adjusted for the Rumble acquisition. N Y S E : X P O F | X P O N E N T I A L F I T N E S S 6March April 2021 Acquires 2020 Xponential’s Evolution: December Launches GO Digital 2018 Platform Acquires October From One to Nine Boutique Brands 2018 Acquires July 2018 Acquires 13 Studios March 71 Licenses 2018 Sold Acquires December 6 Studios 2017 November 76 Licenses Acquires 2017 599 Studios Sold Acquires 713 Licenses September Sold 105 Studios 2017 514 Licenses March Acquires Sold 2015 August 24 Studios Anthony Geisler 2017 107 Licenses Acquires Sold 90 Studios Founded 309 Licenses 122 Studios Sold 371 Licenses 231 Studios 649 Studios Sold 477 Licenses 965 Licenses Sold Sold Total (1) Studios 1) Global studios open and licenses sold, as of June 30, 2021. Adjusted for the Rumble acquisition. N Y S E : X P O F | X P O N E N T I A L F I T N E S S 6
v Our Franchise Model N Y S E : X P O F | X P O N E N T I A L F I T N E S S 7v Our Franchise Model N Y S E : X P O F | X P O N E N T I A L F I T N E S S 7
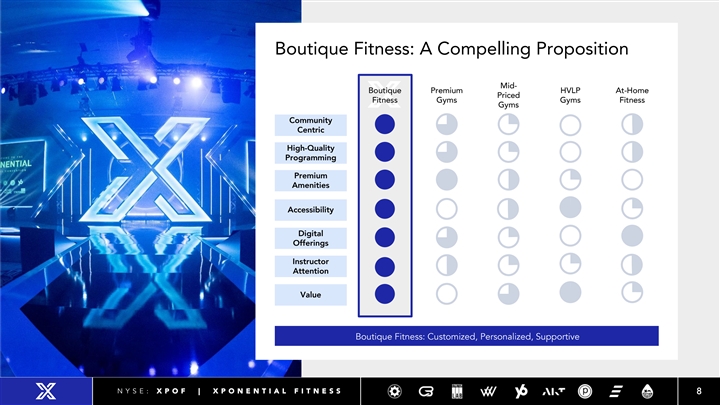
Boutique Fitness: A Compelling Proposition Mid- Boutique Premium HVLP At-Home Priced Fitness Gyms Gyms Fitness Gyms Community Centric High-Quality Programming Premium Amenities Accessibility Digital Offerings Instructor Attention Value Boutique Fitness: Customized, Personalized, Supportive N Y S E : X P O F | X P O N E N T I A L F I T N E S S 8Boutique Fitness: A Compelling Proposition Mid- Boutique Premium HVLP At-Home Priced Fitness Gyms Gyms Fitness Gyms Community Centric High-Quality Programming Premium Amenities Accessibility Digital Offerings Instructor Attention Value Boutique Fitness: Customized, Personalized, Supportive N Y S E : X P O F | X P O N E N T I A L F I T N E S S 8
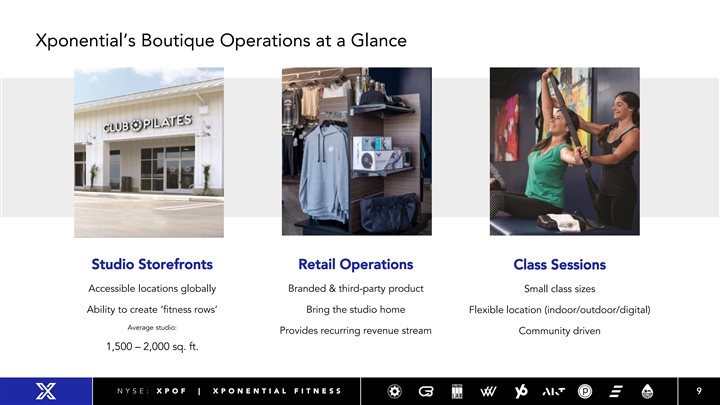
Xponential’s Boutique Operations at a Glance Studio Storefronts Retail Operations Class Sessions Accessible locations globally Branded & third-party product Small class sizes Ability to create ‘fitness rows’ Bring the studio home Flexible location (indoor/outdoor/digital) Average studio: Provides recurring revenue stream Community driven 1,500 – 2,000 sq. ft. N Y S E : X P O F | X P O N E N T I A L F I T N E S S 9Xponential’s Boutique Operations at a Glance Studio Storefronts Retail Operations Class Sessions Accessible locations globally Branded & third-party product Small class sizes Ability to create ‘fitness rows’ Bring the studio home Flexible location (indoor/outdoor/digital) Average studio: Provides recurring revenue stream Community driven 1,500 – 2,000 sq. ft. N Y S E : X P O F | X P O N E N T I A L F I T N E S S 9
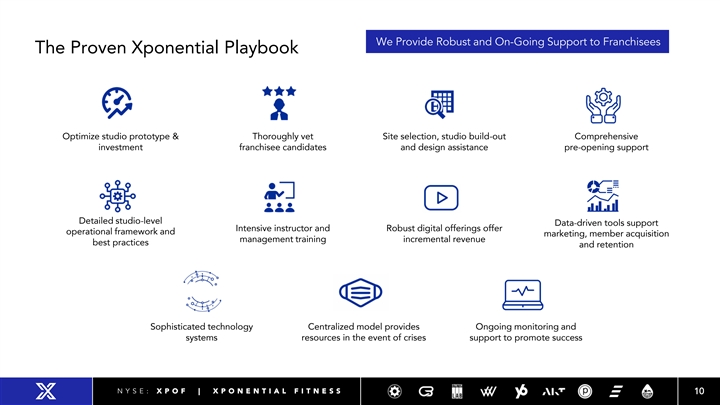
We Provide Robust and On-Going Support to Franchisees The Proven Xponential Playbook Optimize studio prototype & Thoroughly vet Site selection, studio build-out Comprehensive investment franchisee candidates and design assistance pre-opening support Detailed studio-level Data-driven tools support Intensive instructor and Robust digital offerings offer operational framework and marketing, member acquisition management training incremental revenue best practices and retention Sophisticated technology Centralized model provides Ongoing monitoring and systems resources in the event of crises support to promote success N Y S E : X P O F | X P O N E N T I A L F I T N E S S 10We Provide Robust and On-Going Support to Franchisees The Proven Xponential Playbook Optimize studio prototype & Thoroughly vet Site selection, studio build-out Comprehensive investment franchisee candidates and design assistance pre-opening support Detailed studio-level Data-driven tools support Intensive instructor and Robust digital offerings offer operational framework and marketing, member acquisition management training incremental revenue best practices and retention Sophisticated technology Centralized model provides Ongoing monitoring and systems resources in the event of crises support to promote success N Y S E : X P O F | X P O N E N T I A L F I T N E S S 10
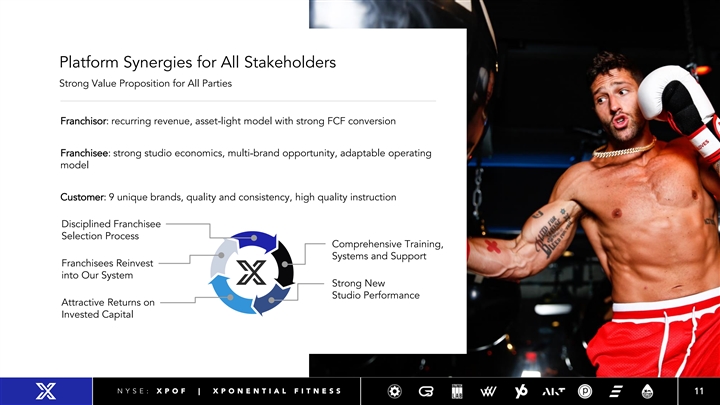
Platform Synergies for All Stakeholders Strong Value Proposition for All Parties Franchisor: recurring revenue, asset-light model with strong FCF conversion Franchisee: strong studio economics, multi-brand opportunity, adaptable operating model Customer: 9 unique brands, quality and consistency, high quality instruction Disciplined Franchisee Selection Process Comprehensive Training, Systems and Support Franchisees Reinvest into Our System Strong New Studio Performance Attractive Returns on Invested Capital N Y S E : X P O F | X P O N E N T I A L F I T N E S S 11Platform Synergies for All Stakeholders Strong Value Proposition for All Parties Franchisor: recurring revenue, asset-light model with strong FCF conversion Franchisee: strong studio economics, multi-brand opportunity, adaptable operating model Customer: 9 unique brands, quality and consistency, high quality instruction Disciplined Franchisee Selection Process Comprehensive Training, Systems and Support Franchisees Reinvest into Our System Strong New Studio Performance Attractive Returns on Invested Capital N Y S E : X P O F | X P O N E N T I A L F I T N E S S 11
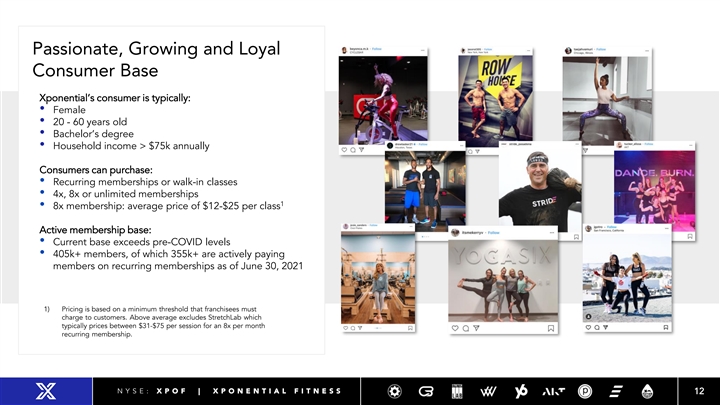
Passionate, Growing and Loyal Consumer Base Xponential’s consumer is typically: • Female • 20 - 60 years old • Bachelor’s degree • Household income > $75k annually Consumers can purchase: • Recurring memberships or walk-in classes • 4x, 8x or unlimited memberships 1 • 8x membership: average price of $12-$25 per class Active membership base: • Current base exceeds pre-COVID levels • 405k+ members, of which 355k+ are actively paying members on recurring memberships as of June 30, 2021 1) Pricing is based on a minimum threshold that franchisees must charge to customers. Above average excludes StretchLab which typically prices between $31-$75 per session for an 8x per month recurring membership. N Y S E : X P O F | X P O N E N T I A L F I T N E S S 12Passionate, Growing and Loyal Consumer Base Xponential’s consumer is typically: • Female • 20 - 60 years old • Bachelor’s degree • Household income > $75k annually Consumers can purchase: • Recurring memberships or walk-in classes • 4x, 8x or unlimited memberships 1 • 8x membership: average price of $12-$25 per class Active membership base: • Current base exceeds pre-COVID levels • 405k+ members, of which 355k+ are actively paying members on recurring memberships as of June 30, 2021 1) Pricing is based on a minimum threshold that franchisees must charge to customers. Above average excludes StretchLab which typically prices between $31-$75 per session for an 8x per month recurring membership. N Y S E : X P O F | X P O N E N T I A L F I T N E S S 12
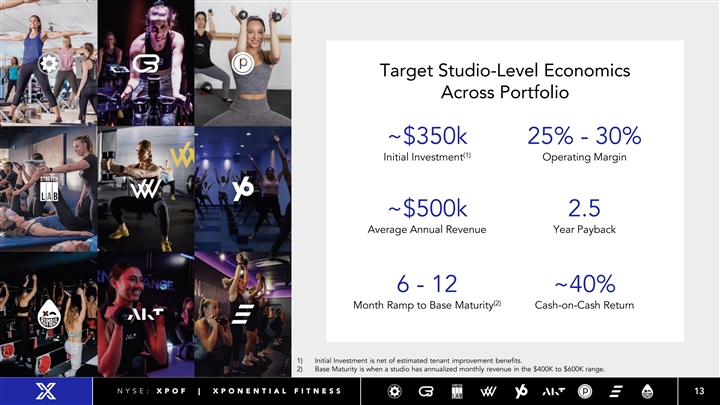
Target Studio-Level Economics Across Portfolio ~$350k 25% - 30% (1) Initial Investment Operating Margin ~$500k 2.5 Average Annual Revenue Year Payback 6 - 12 ~40% (2) Month Ramp to Base Maturity Cash-on-Cash Return 1) Initial Investment is net of estimated tenant improvement benefits. 2) Base Maturity is when a studio has annualized monthly revenue in the $400K to $600K range. N Y S E : X P O F | X P O N E N T I A L F I T N E S S 13Target Studio-Level Economics Across Portfolio ~$350k 25% - 30% (1) Initial Investment Operating Margin ~$500k 2.5 Average Annual Revenue Year Payback 6 - 12 ~40% (2) Month Ramp to Base Maturity Cash-on-Cash Return 1) Initial Investment is net of estimated tenant improvement benefits. 2) Base Maturity is when a studio has annualized monthly revenue in the $400K to $600K range. N Y S E : X P O F | X P O N E N T I A L F I T N E S S 13
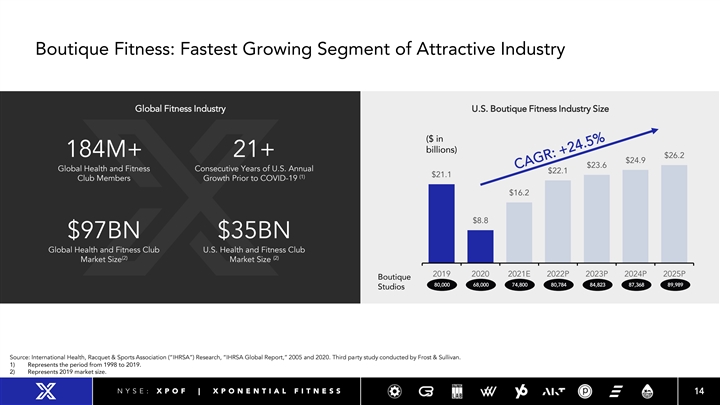
Boutique Fitness: Fastest Growing Segment of Attractive Industry Global Fitness Industry U.S. Boutique Fitness Industry Size ($ in billions) 184M+ 21+ $26.2 $24.9 $23.6 Global Health and Fitness Consecutive Years of U.S. Annual $22.1 $21.1 (1) Club Members Growth Prior to COVID-19 $16.2 $8.8 $97BN $35BN Global Health and Fitness Club U.S. Health and Fitness Club (2) (2) Market Size Market Size 2019 2020 2021E 2022P 2023P 2024P 2025P Boutique 80,000 68,000 74,800 80,784 84,823 87,368 89,989 Studios Source: International Health, Racquet & Sports Association (“IHRSA”) Research, “IHRSA Global Report,” 2005 and 2020. Third party study conducted by Frost & Sullivan. 1) Represents the period from 1998 to 2019. 2) Represents 2019 market size. N Y S E : X P O F | X P O N E N T I A L F I T N E S S 14Boutique Fitness: Fastest Growing Segment of Attractive Industry Global Fitness Industry U.S. Boutique Fitness Industry Size ($ in billions) 184M+ 21+ $26.2 $24.9 $23.6 Global Health and Fitness Consecutive Years of U.S. Annual $22.1 $21.1 (1) Club Members Growth Prior to COVID-19 $16.2 $8.8 $97BN $35BN Global Health and Fitness Club U.S. Health and Fitness Club (2) (2) Market Size Market Size 2019 2020 2021E 2022P 2023P 2024P 2025P Boutique 80,000 68,000 74,800 80,784 84,823 87,368 89,989 Studios Source: International Health, Racquet & Sports Association (“IHRSA”) Research, “IHRSA Global Report,” 2005 and 2020. Third party study conducted by Frost & Sullivan. 1) Represents the period from 1998 to 2019. 2) Represents 2019 market size. N Y S E : X P O F | X P O N E N T I A L F I T N E S S 14
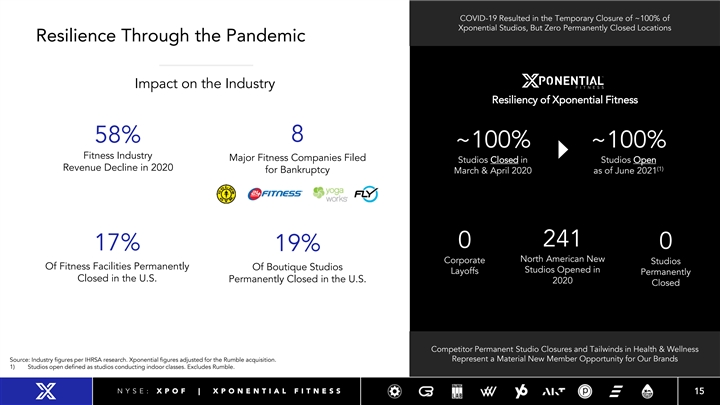
COVID-19 Resulted in the Temporary Closure of ~100% of Xponential Studios, But Zero Permanently Closed Locations Resilience Through the Pandemic Impact on the Industry Resiliency of Xponential Fitness 8 58% ~100% ~100% Fitness Industry Major Fitness Companies Filed Studios Closed in Studios Open Revenue Decline in 2020 (1) for Bankruptcy March & April 2020 as of June 2021 241 0 0 17% 19% North American New Corporate Studios Of Fitness Facilities Permanently Of Boutique Studios Studios Opened in Layoffs Permanently Closed in the U.S. Permanently Closed in the U.S. 2020 Closed Competitor Permanent Studio Closures and Tailwinds in Health & Wellness Source: Industry figures per IHRSA research. Xponential figures adjusted for the Rumble acquisition. Represent a Material New Member Opportunity for Our Brands 1) Studios open defined as studios conducting indoor classes. Excludes Rumble. N Y S E : X P O F | X P O N E N T I A L F I T N E S S 15COVID-19 Resulted in the Temporary Closure of ~100% of Xponential Studios, But Zero Permanently Closed Locations Resilience Through the Pandemic Impact on the Industry Resiliency of Xponential Fitness 8 58% ~100% ~100% Fitness Industry Major Fitness Companies Filed Studios Closed in Studios Open Revenue Decline in 2020 (1) for Bankruptcy March & April 2020 as of June 2021 241 0 0 17% 19% North American New Corporate Studios Of Fitness Facilities Permanently Of Boutique Studios Studios Opened in Layoffs Permanently Closed in the U.S. Permanently Closed in the U.S. 2020 Closed Competitor Permanent Studio Closures and Tailwinds in Health & Wellness Source: Industry figures per IHRSA research. Xponential figures adjusted for the Rumble acquisition. Represent a Material New Member Opportunity for Our Brands 1) Studios open defined as studios conducting indoor classes. Excludes Rumble. N Y S E : X P O F | X P O N E N T I A L F I T N E S S 15
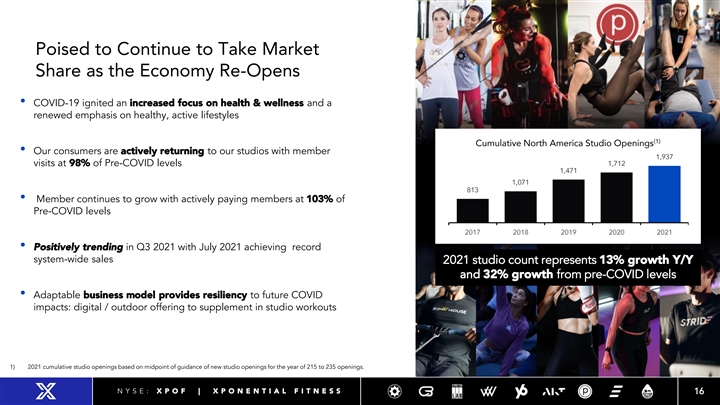
Poised to Continue to Take Market Share as the Economy Re-Opens • COVID-19 ignited an increased focus on health & wellness and a renewed emphasis on healthy, active lifestyles (1) Cumulative North America Studio Openings • Our consumers are actively returning to our studios with member 1,937 visits at 98% of Pre-COVID levels 1,712 1,471 1,071 813 • Member continues to grow with actively paying members at 103% of Pre-COVID levels 2017 2018 2019 2020 2021 • Positively trending in Q3 2021 with July 2021 achieving record system-wide sales 2021 studio count represents 13% growth Y/Y and 32% growth from pre-COVID levels • Adaptable business model provides resiliency to future COVID impacts: digital / outdoor offering to supplement in studio workouts 1) 2021 cumulative studio openings based on midpoint of guidance of new studio openings for the year of 215 to 235 openings. N Y S E : X P O F | X P O N E N T I A L F I T N E S S 16Poised to Continue to Take Market Share as the Economy Re-Opens • COVID-19 ignited an increased focus on health & wellness and a renewed emphasis on healthy, active lifestyles (1) Cumulative North America Studio Openings • Our consumers are actively returning to our studios with member 1,937 visits at 98% of Pre-COVID levels 1,712 1,471 1,071 813 • Member continues to grow with actively paying members at 103% of Pre-COVID levels 2017 2018 2019 2020 2021 • Positively trending in Q3 2021 with July 2021 achieving record system-wide sales 2021 studio count represents 13% growth Y/Y and 32% growth from pre-COVID levels • Adaptable business model provides resiliency to future COVID impacts: digital / outdoor offering to supplement in studio workouts 1) 2021 cumulative studio openings based on midpoint of guidance of new studio openings for the year of 215 to 235 openings. N Y S E : X P O F | X P O N E N T I A L F I T N E S S 16
Four Key Strategies for our Growth Grow Our Franchised Studio Base Across All Brands in North America Grow Our Brands and Studio Footprint Internationally Drive System-Wide Same Store Sales and Grow AUVs Expand Operating Margins and Drive Free Cash Flow Conversion N Y S E : X P O F | X P O N E N T I A L F I T N E S S 17Four Key Strategies for our Growth Grow Our Franchised Studio Base Across All Brands in North America Grow Our Brands and Studio Footprint Internationally Drive System-Wide Same Store Sales and Grow AUVs Expand Operating Margins and Drive Free Cash Flow Conversion N Y S E : X P O F | X P O N E N T I A L F I T N E S S 17
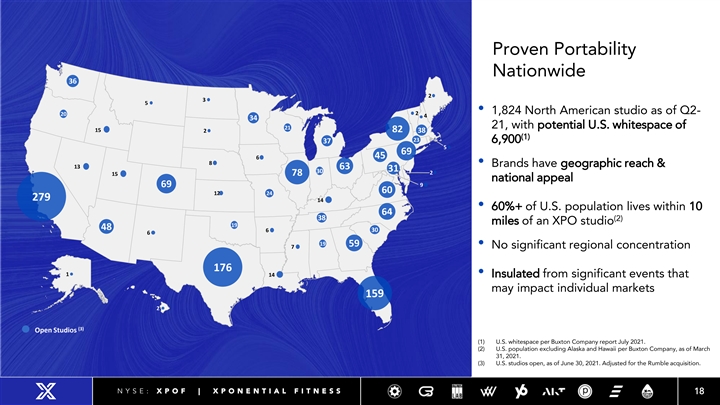
Proven Portability Nationwide • 1,824 North American studio as of Q2- 21, with potential U.S. whitespace of 15 82 (1) 6,900 69 • Brands have geographic reach & 13 15 78 national appeal 279 14 • 60%+ of U.S. population lives within 10 (2) miles of an XPO studio • No significant regional concentration 176 14• Insulated from significant events that may impact individual markets 1395042_ 1395042_ 1395042_ 1395042_ 1395042_ 1395042_ 1395042_ 1395042_ 1395042_ 1395042_ 1395042_ 1395042_ 1395042_ 1395042_ 1395042_ 1395042_ 1395042_ 1395042_ 1395042_ 1395042_ 1395042_ 1395042_ 1395042_ 1395042_ 1395042_ 1395042_ 1395042_ 1395042_ 1395042_ 1395042_ 1395042_ 1395042_ 1395042_ 1395042_ 1395042_ 1395042_ 1395042_ 1395042_ 1395042_ 1395042_ 1395042_ 1395042_1.wor 1.wor 1.wor 1.wor 1.wor 1.wor 1.wor 1.wor 1.wor 1.wor 1.wor 1.wor 1.wor 1.wor 1.wor 1.wor 1.wor 1.wor 1.wor 1.wor 1.wor 1.wor 1.wor 1.wor 1.wor 1.wor 1.wor 1.wor 1.wor 1.wor 1.wor 1.wor 1.wor 1.wor 1.wor 1.wor 1.wor 1.wor 1.wor 1.wor 1.wor 1.wor (3) 1395042_ 1395042_ 1395042_ 1395042_ 1395042_ 1395042_ 1395042_1.wor 1.wor 1.wor 1.wor 1.wor 1.wor 1.wor 1395042_ 1395042_ 1395042_ 1395042_ 1395042_ 1395042_ 1395042_ 1395042_ 1395042_ 1395042_ 1395042_ 1395042_ 1395042_ 1395042_ 1395042_ 1395042_ 1395042_ 1395042_ 1395042_ 1395042_ 1395042_ 1395042_ 1395042_ 1395042_ 1395042_ 1395042_ 1395042_ 1395042_ 1.wo 1.wo 1.wo 1.wo 1.wo 1.wo 1.wo 1.wo 1.wo 1.wo 1.wo 1.wo 1.wo 1.wo 1.wo 1.wo 1.wo 1.wo 1.wo 1.wo 1.wo 1.wo 1.wo 1.wo 1.wo 1.wo 1.wo 1.wo r r r r r r r r r r r r r r r r r r r r r r r r r r r r Open Studios 1395042_ 1395042_ 1395042_ 1395042_ 1395042_ 1395042_ 1395042_ 1395042_ 1395042_ 1395042_ 1395042_ 1395042_ 1395042_ 1395042_ 1395042_ 1395042_ 1395042_ 1395042_ 1395042_ 1395042_ 1395042_ 1.wo 1.wo 1.wo 1.wo 1.wo 1.wo 1.wo 1.wo 1.wo 1.wo 1.wo 1.wo 1.wo 1.wo 1.wo 1.wo 1.wo 1.wo 1.wo 1.wo 1.wo r r r r r r r r r r r r r r r r r r r r r (1) U.S. whitespace per Buxton Company report July 2021. 1395042_ 1395042_ 1395042_ 1395042_ 1395042_ 1395042_ 1395042_ 1395042_ 1395042_ 1395042_ 1395042_ 1395042_ 1395042_ 1395042_ 1395042_ 1395042_ 1395042_ 1395042_ 1395042_ 1395042_ 1395042_ 1395042_ 1395042_ 1395042_ 1395042_ 1395042_ 1395042_ 1395042_ 1395042_ 1395042_ 1395042_ 1395042_ 1395042_ 1395042_ 1395042_ 1395042_ 1395042_ 1395042_ 1395042_ 1395042_ 1395042_ 1395042_1.wor 1.wor 1.wor 1.wor 1.wor 1.wor 1.wor 1.wor 1.wor 1.wor 1.wor 1.wor 1.wor 1.wor 1.wor 1.wor 1.wor 1.wor 1.wor 1.wor 1.wor 1.wor 1.wor 1.wor 1.wor 1.wor 1.wor 1.wor 1.wor 1.wor 1.wor 1.wor 1.wor 1.wor 1.wor 1.wor 1.wor 1.wor 1.wor 1.wor 1.wor 1.wor 1395042_ 1395042_ 1395042_ 1395042_ 1395042_ 1395042_ 1395042_1.wor 1.wor 1.wor 1.wor 1.wor 1.wor 1.wor (2) U.S. population excluding Alaska and Hawaii per Buxton Company, as of March 31, 2021. (3) U.S. studios open, as of June 30, 2021. Adjusted for the Rumble acquisition. N Y S E : X P O F | X P O N E N T I A L F I T N E S S 18Proven Portability Nationwide • 1,824 North American studio as of Q2- 21, with potential U.S. whitespace of 15 82 (1) 6,900 69 • Brands have geographic reach & 13 15 78 national appeal 279 14 • 60%+ of U.S. population lives within 10 (2) miles of an XPO studio • No significant regional concentration 176 14• Insulated from significant events that may impact individual markets 1395042_ 1395042_ 1395042_ 1395042_ 1395042_ 1395042_ 1395042_ 1395042_ 1395042_ 1395042_ 1395042_ 1395042_ 1395042_ 1395042_ 1395042_ 1395042_ 1395042_ 1395042_ 1395042_ 1395042_ 1395042_ 1395042_ 1395042_ 1395042_ 1395042_ 1395042_ 1395042_ 1395042_ 1395042_ 1395042_ 1395042_ 1395042_ 1395042_ 1395042_ 1395042_ 1395042_ 1395042_ 1395042_ 1395042_ 1395042_ 1395042_ 1395042_1.wor 1.wor 1.wor 1.wor 1.wor 1.wor 1.wor 1.wor 1.wor 1.wor 1.wor 1.wor 1.wor 1.wor 1.wor 1.wor 1.wor 1.wor 1.wor 1.wor 1.wor 1.wor 1.wor 1.wor 1.wor 1.wor 1.wor 1.wor 1.wor 1.wor 1.wor 1.wor 1.wor 1.wor 1.wor 1.wor 1.wor 1.wor 1.wor 1.wor 1.wor 1.wor (3) 1395042_ 1395042_ 1395042_ 1395042_ 1395042_ 1395042_ 1395042_1.wor 1.wor 1.wor 1.wor 1.wor 1.wor 1.wor 1395042_ 1395042_ 1395042_ 1395042_ 1395042_ 1395042_ 1395042_ 1395042_ 1395042_ 1395042_ 1395042_ 1395042_ 1395042_ 1395042_ 1395042_ 1395042_ 1395042_ 1395042_ 1395042_ 1395042_ 1395042_ 1395042_ 1395042_ 1395042_ 1395042_ 1395042_ 1395042_ 1395042_ 1.wo 1.wo 1.wo 1.wo 1.wo 1.wo 1.wo 1.wo 1.wo 1.wo 1.wo 1.wo 1.wo 1.wo 1.wo 1.wo 1.wo 1.wo 1.wo 1.wo 1.wo 1.wo 1.wo 1.wo 1.wo 1.wo 1.wo 1.wo r r r r r r r r r r r r r r r r r r r r r r r r r r r r Open Studios 1395042_ 1395042_ 1395042_ 1395042_ 1395042_ 1395042_ 1395042_ 1395042_ 1395042_ 1395042_ 1395042_ 1395042_ 1395042_ 1395042_ 1395042_ 1395042_ 1395042_ 1395042_ 1395042_ 1395042_ 1395042_ 1.wo 1.wo 1.wo 1.wo 1.wo 1.wo 1.wo 1.wo 1.wo 1.wo 1.wo 1.wo 1.wo 1.wo 1.wo 1.wo 1.wo 1.wo 1.wo 1.wo 1.wo r r r r r r r r r r r r r r r r r r r r r (1) U.S. whitespace per Buxton Company report July 2021. 1395042_ 1395042_ 1395042_ 1395042_ 1395042_ 1395042_ 1395042_ 1395042_ 1395042_ 1395042_ 1395042_ 1395042_ 1395042_ 1395042_ 1395042_ 1395042_ 1395042_ 1395042_ 1395042_ 1395042_ 1395042_ 1395042_ 1395042_ 1395042_ 1395042_ 1395042_ 1395042_ 1395042_ 1395042_ 1395042_ 1395042_ 1395042_ 1395042_ 1395042_ 1395042_ 1395042_ 1395042_ 1395042_ 1395042_ 1395042_ 1395042_ 1395042_1.wor 1.wor 1.wor 1.wor 1.wor 1.wor 1.wor 1.wor 1.wor 1.wor 1.wor 1.wor 1.wor 1.wor 1.wor 1.wor 1.wor 1.wor 1.wor 1.wor 1.wor 1.wor 1.wor 1.wor 1.wor 1.wor 1.wor 1.wor 1.wor 1.wor 1.wor 1.wor 1.wor 1.wor 1.wor 1.wor 1.wor 1.wor 1.wor 1.wor 1.wor 1.wor 1395042_ 1395042_ 1395042_ 1395042_ 1395042_ 1395042_ 1395042_1.wor 1.wor 1.wor 1.wor 1.wor 1.wor 1.wor (2) U.S. population excluding Alaska and Hawaii per Buxton Company, as of March 31, 2021. (3) U.S. studios open, as of June 30, 2021. Adjusted for the Rumble acquisition. N Y S E : X P O F | X P O N E N T I A L F I T N E S S 18
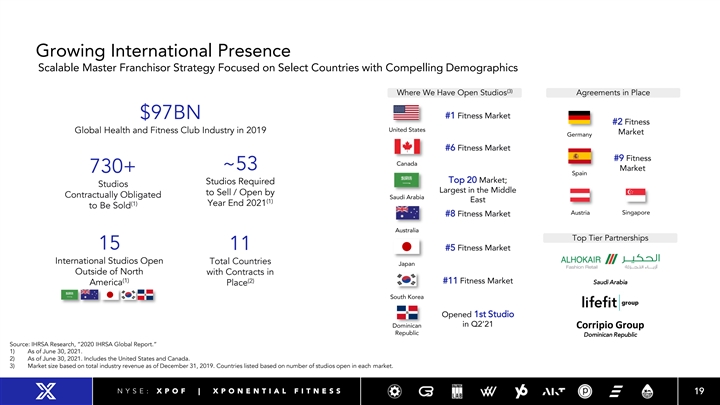
Growing International Presence Scalable Master Franchisor Strategy Focused on Select Countries with Compelling Demographics (3) Where We Have Open Studios Agreements in Place #1 Fitness Market $97BN #2 Fitness United States Global Health and Fitness Club Industry in 2019 Market Germany #6 Fitness Market #9 Fitness Canada ~53 Market 730+ Spain Top 20 Market; Studios Required Studios Largest in the Middle to Sell / Open by Contractually Obligated Saudi Arabia East (1) (1) Year End 2021 to Be Sold Austria Singapore #8 Fitness Market Australia Top Tier Partnerships 15 11 #5 Fitness Market International Studios Open Total Countries Japan Outside of North with Contracts in (1) (2) #11 Fitness Market Saudi Arabia America Place South Korea Opened 1st Studio in Q2’21 Dominican Corripio Group Republic Dominican Republic Source: IHRSA Research, “2020 IHRSA Global Report.” 1) As of June 30, 2021. 2) As of June 30, 2021. Includes the United States and Canada. 3) Market size based on total industry revenue as of December 31, 2019. Countries listed based on number of studios open in each market. N Y S E : X P O F | X P O N E N T I A L F I T N E S S 19Growing International Presence Scalable Master Franchisor Strategy Focused on Select Countries with Compelling Demographics (3) Where We Have Open Studios Agreements in Place #1 Fitness Market $97BN #2 Fitness United States Global Health and Fitness Club Industry in 2019 Market Germany #6 Fitness Market #9 Fitness Canada ~53 Market 730+ Spain Top 20 Market; Studios Required Studios Largest in the Middle to Sell / Open by Contractually Obligated Saudi Arabia East (1) (1) Year End 2021 to Be Sold Austria Singapore #8 Fitness Market Australia Top Tier Partnerships 15 11 #5 Fitness Market International Studios Open Total Countries Japan Outside of North with Contracts in (1) (2) #11 Fitness Market Saudi Arabia America Place South Korea Opened 1st Studio in Q2’21 Dominican Corripio Group Republic Dominican Republic Source: IHRSA Research, “2020 IHRSA Global Report.” 1) As of June 30, 2021. 2) As of June 30, 2021. Includes the United States and Canada. 3) Market size based on total industry revenue as of December 31, 2019. Countries listed based on number of studios open in each market. N Y S E : X P O F | X P O N E N T I A L F I T N E S S 19
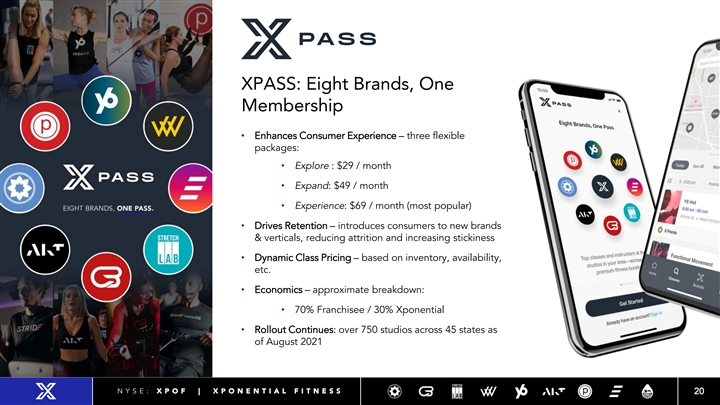
XPASS: Eight Brands, One Membership • Enhances Consumer Experience – three flexible packages: • Explore : $29 / month • Expand: $49 / month • Experience: $69 / month (most popular) • Drives Retention – introduces consumers to new brands & verticals, reducing attrition and increasing stickiness • Dynamic Class Pricing – based on inventory, availability, etc. • Economics – approximate breakdown: • 70% Franchisee / 30% Xponential • Rollout Continues: over 750 studios across 45 states as of August 2021 N Y S E : X P O F | X P O N E N T I A L F I T N E S S 20XPASS: Eight Brands, One Membership • Enhances Consumer Experience – three flexible packages: • Explore : $29 / month • Expand: $49 / month • Experience: $69 / month (most popular) • Drives Retention – introduces consumers to new brands & verticals, reducing attrition and increasing stickiness • Dynamic Class Pricing – based on inventory, availability, etc. • Economics – approximate breakdown: • 70% Franchisee / 30% Xponential • Rollout Continues: over 750 studios across 45 states as of August 2021 N Y S E : X P O F | X P O N E N T I A L F I T N E S S 20
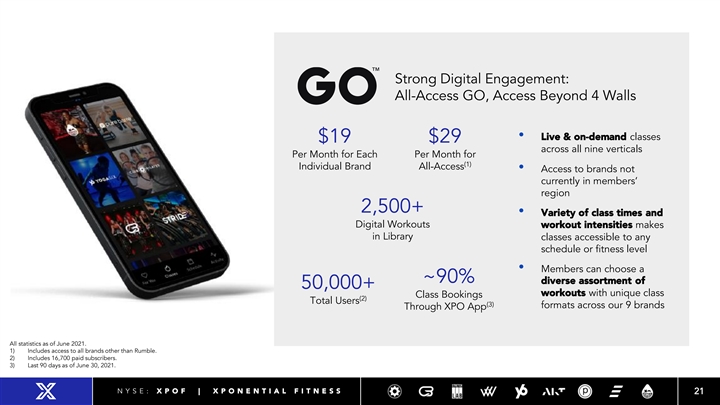
Strong Digital Engagement: All-Access GO, Access Beyond 4 Walls • Live & on-demand classes $19 $29 across all nine verticals Per Month for Each Per Month for (1) Individual Brand All-Access • Access to brands not currently in members’ region 2,500+ • Variety of class times and Digital Workouts workout intensities makes in Library classes accessible to any schedule or fitness level • Members can choose a ~90% diverse assortment of 50,000+ workouts with unique class Class Bookings (2) Total Users (3) formats across our 9 brands Through XPO App All statistics as of June 2021. 1) Includes access to all brands other than Rumble. 2) Includes 16,700 paid subscribers. 3) Last 90 days as of June 30, 2021. N Y S E : X P O F | X P O N E N T I A L F I T N E S S 21Strong Digital Engagement: All-Access GO, Access Beyond 4 Walls • Live & on-demand classes $19 $29 across all nine verticals Per Month for Each Per Month for (1) Individual Brand All-Access • Access to brands not currently in members’ region 2,500+ • Variety of class times and Digital Workouts workout intensities makes in Library classes accessible to any schedule or fitness level • Members can choose a ~90% diverse assortment of 50,000+ workouts with unique class Class Bookings (2) Total Users (3) formats across our 9 brands Through XPO App All statistics as of June 2021. 1) Includes access to all brands other than Rumble. 2) Includes 16,700 paid subscribers. 3) Last 90 days as of June 30, 2021. N Y S E : X P O F | X P O N E N T I A L F I T N E S S 21
Financial Overview N Y S E : X P O F | X P O N E N T I A L F I T N E S S 22Financial Overview N Y S E : X P O F | X P O N E N T I A L F I T N E S S 22
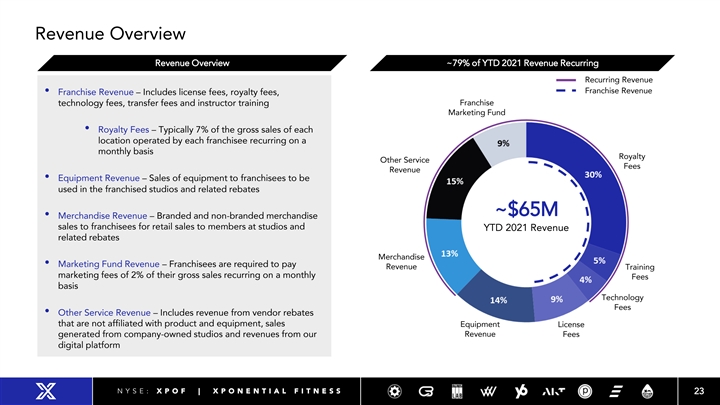
Revenue Overview Revenue Overview ~79% of YTD 2021 Revenue Recurring Recurring Revenue Franchise Revenue • Franchise Revenue – Includes license fees, royalty fees, technology fees, transfer fees and instructor training Franchise Marketing Fund • Royalty Fees – Typically 7% of the gross sales of each location operated by each franchisee recurring on a monthly basis Royalty Other Service Fees Revenue • Equipment Revenue – Sales of equipment to franchisees to be used in the franchised studios and related rebates ~$65M • Merchandise Revenue – Branded and non-branded merchandise sales to franchisees for retail sales to members at studios and YTD 2021 Revenue related rebates Merchandise • Marketing Fund Revenue – Franchisees are required to pay Revenue Training marketing fees of 2% of their gross sales recurring on a monthly Fees basis Technology Fees • Other Service Revenue – Includes revenue from vendor rebates that are not affiliated with product and equipment, sales Equipment License generated from company-owned studios and revenues from our Revenue Fees digital platform N Y S E : X P O F | X P O N E N T I A L F I T N E S S 23Revenue Overview Revenue Overview ~79% of YTD 2021 Revenue Recurring Recurring Revenue Franchise Revenue • Franchise Revenue – Includes license fees, royalty fees, technology fees, transfer fees and instructor training Franchise Marketing Fund • Royalty Fees – Typically 7% of the gross sales of each location operated by each franchisee recurring on a monthly basis Royalty Other Service Fees Revenue • Equipment Revenue – Sales of equipment to franchisees to be used in the franchised studios and related rebates ~$65M • Merchandise Revenue – Branded and non-branded merchandise sales to franchisees for retail sales to members at studios and YTD 2021 Revenue related rebates Merchandise • Marketing Fund Revenue – Franchisees are required to pay Revenue Training marketing fees of 2% of their gross sales recurring on a monthly Fees basis Technology Fees • Other Service Revenue – Includes revenue from vendor rebates that are not affiliated with product and equipment, sales Equipment License generated from company-owned studios and revenues from our Revenue Fees digital platform N Y S E : X P O F | X P O N E N T I A L F I T N E S S 23
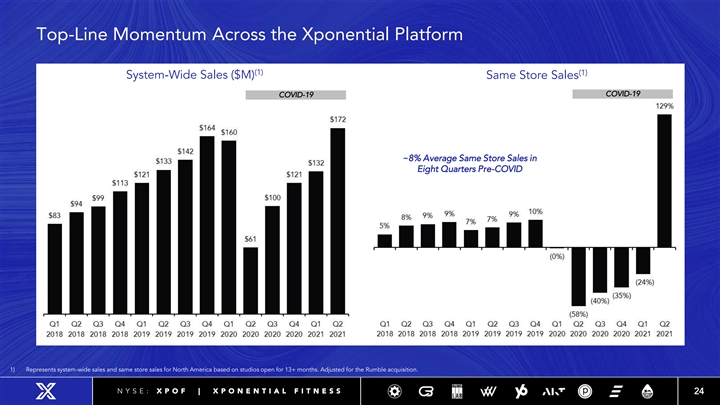
Top-Line Momentum Across the Xponential Platform (1) (1) System-Wide Sales ($M) Same Store Sales COVID-19 COVID-19 ~8% Average Same Store Sales in Eight Quarters Pre-COVID 1) Represents system-wide sales and same store sales for North America based on studios open for 13+ months. Adjusted for the Rumble acquisition. N Y S E : X P O F | X P O N E N T I A L F I T N E S S 24Top-Line Momentum Across the Xponential Platform (1) (1) System-Wide Sales ($M) Same Store Sales COVID-19 COVID-19 ~8% Average Same Store Sales in Eight Quarters Pre-COVID 1) Represents system-wide sales and same store sales for North America based on studios open for 13+ months. Adjusted for the Rumble acquisition. N Y S E : X P O F | X P O N E N T I A L F I T N E S S 24
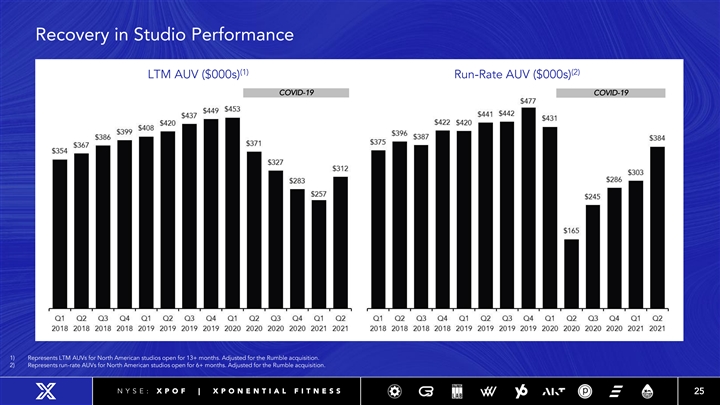
Recovery in Studio Performance (1) (2) LTM AUV ($000s) Run-Rate AUV ($000s) COVID-19 COVID-19 1) Represents LTM AUVs for North American studios open for 13+ months. Adjusted for the Rumble acquisition. 2) Represents run-rate AUVs for North American studios open for 6+ months. Adjusted for the Rumble acquisition. N Y S E : X P O F | X P O N E N T I A L F I T N E S S 25Recovery in Studio Performance (1) (2) LTM AUV ($000s) Run-Rate AUV ($000s) COVID-19 COVID-19 1) Represents LTM AUVs for North American studios open for 13+ months. Adjusted for the Rumble acquisition. 2) Represents run-rate AUVs for North American studios open for 6+ months. Adjusted for the Rumble acquisition. N Y S E : X P O F | X P O N E N T I A L F I T N E S S 25
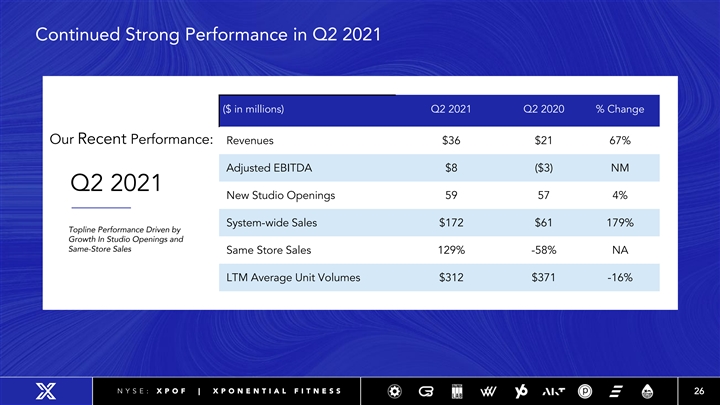
Continued Strong Performance in Q2 2021 ($ in millions) Q2 2021 Q2 2020 % Change Our Recent Performance: Revenues $36 $21 67% Adjusted EBITDA $8 ($3) NM Q2 2021 New Studio Openings 59 57 4% System-wide Sales $172 $61 179% Topline Performance Driven by Growth In Studio Openings and Same-Store Sales Same Store Sales 129% -58% NA LTM Average Unit Volumes $312 $371 -16% N Y S E : X P O F | X P O N E N T I A L F I T N E S S 26Continued Strong Performance in Q2 2021 ($ in millions) Q2 2021 Q2 2020 % Change Our Recent Performance: Revenues $36 $21 67% Adjusted EBITDA $8 ($3) NM Q2 2021 New Studio Openings 59 57 4% System-wide Sales $172 $61 179% Topline Performance Driven by Growth In Studio Openings and Same-Store Sales Same Store Sales 129% -58% NA LTM Average Unit Volumes $312 $371 -16% N Y S E : X P O F | X P O N E N T I A L F I T N E S S 26
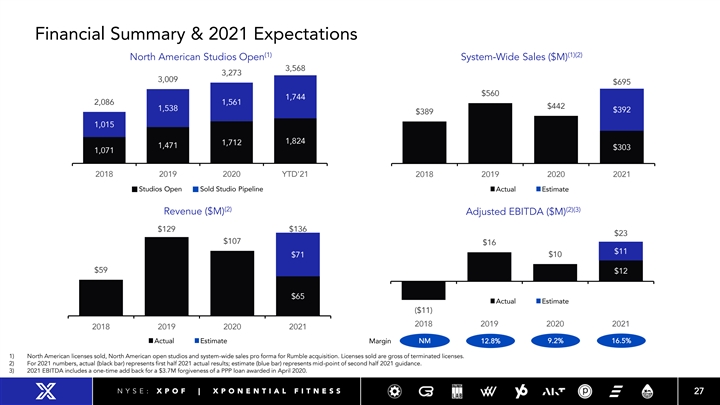
Financial Summary & 2021 Expectations (1) (1)(2) North American Studios Open System-Wide Sales ($M) 3,568 3,273 3,009 $695 $560 1,744 2,086 1,561 $442 1,538 $392 $389 1,015 1,824 1,712 1,471 $303 1,071 2018 2019 2020 YTD'21 2018 2019 2020 2021 Studios Open Sold Studio Pipeline Actual Estimate (2) (2)(3) Revenue ($M) Adjusted EBITDA ($M) $129 $136 $23 $107 $16 $11 $10 $71 $59 $12 $65 Actual Estimate ($11) 2018 2019 2020 2021 2018 2019 2020 2021 Actual Estimate NM 12.8% 9.2% 16.5% Margin 1) North American licenses sold, North American open studios and system-wide sales pro forma for Rumble acquisition. Licenses sold are gross of terminated licenses. 2) For 2021 numbers, actual (black bar) represents first half 2021 actual results; estimate (blue bar) represents mid-point of second half 2021 guidance. 3) 2021 EBITDA includes a one-time add back for a $3.7M forgiveness of a PPP loan awarded in April 2020. N Y S E : X P O F | X P O N E N T I A L F I T N E S S 27Financial Summary & 2021 Expectations (1) (1)(2) North American Studios Open System-Wide Sales ($M) 3,568 3,273 3,009 $695 $560 1,744 2,086 1,561 $442 1,538 $392 $389 1,015 1,824 1,712 1,471 $303 1,071 2018 2019 2020 YTD'21 2018 2019 2020 2021 Studios Open Sold Studio Pipeline Actual Estimate (2) (2)(3) Revenue ($M) Adjusted EBITDA ($M) $129 $136 $23 $107 $16 $11 $10 $71 $59 $12 $65 Actual Estimate ($11) 2018 2019 2020 2021 2018 2019 2020 2021 Actual Estimate NM 12.8% 9.2% 16.5% Margin 1) North American licenses sold, North American open studios and system-wide sales pro forma for Rumble acquisition. Licenses sold are gross of terminated licenses. 2) For 2021 numbers, actual (black bar) represents first half 2021 actual results; estimate (blue bar) represents mid-point of second half 2021 guidance. 3) 2021 EBITDA includes a one-time add back for a $3.7M forgiveness of a PPP loan awarded in April 2020. N Y S E : X P O F | X P O N E N T I A L F I T N E S S 27
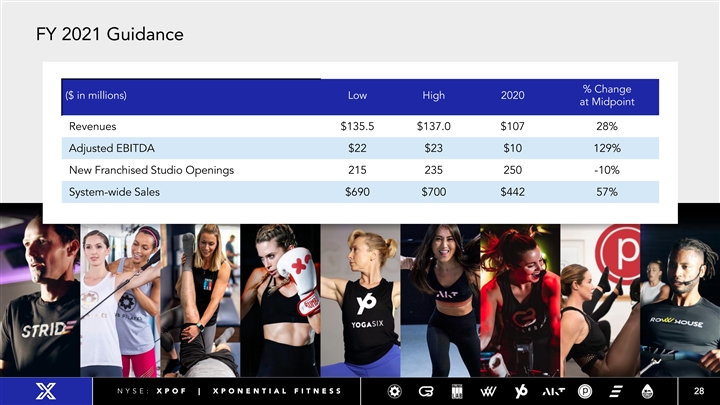
FY 2021 Guidance % Change ($ in millions) Low High 2020 at Midpoint Revenues $135.5 $137.0 $107 28% Adjusted EBITDA $22 $23 $10 129% New Franchised Studio Openings 215 235 250 -10% System-wide Sales $690 $700 $442 57% N Y S E : X P O F | X P O N E N T I A L F I T N E S S 28FY 2021 Guidance % Change ($ in millions) Low High 2020 at Midpoint Revenues $135.5 $137.0 $107 28% Adjusted EBITDA $22 $23 $10 129% New Franchised Studio Openings 215 235 250 -10% System-wide Sales $690 $700 $442 57% N Y S E : X P O F | X P O N E N T I A L F I T N E S S 28
Investment Highlights • Diversified portfolio of leading boutique fitness brands • Market leading position with significant scale • Passionate, growing and loyal consumer base • Xponential Playbook supports system-wide operational excellence • Asset-light franchise model and predictable recurring revenue streams support strong free cash flow conversion • Highly attractive and predictable studio-level economics • Large and expanding franchisee base with visible organic growth • Proven and experienced management team with an entrepreneurial culture N Y S E : X P O F | X P O N E N T I A L F I T N E S S 29Investment Highlights • Diversified portfolio of leading boutique fitness brands • Market leading position with significant scale • Passionate, growing and loyal consumer base • Xponential Playbook supports system-wide operational excellence • Asset-light franchise model and predictable recurring revenue streams support strong free cash flow conversion • Highly attractive and predictable studio-level economics • Large and expanding franchisee base with visible organic growth • Proven and experienced management team with an entrepreneurial culture N Y S E : X P O F | X P O N E N T I A L F I T N E S S 29
Appendix N Y S E : X P O F | X P O N E N T I A L F I T N E S S 30Appendix N Y S E : X P O F | X P O N E N T I A L F I T N E S S 30
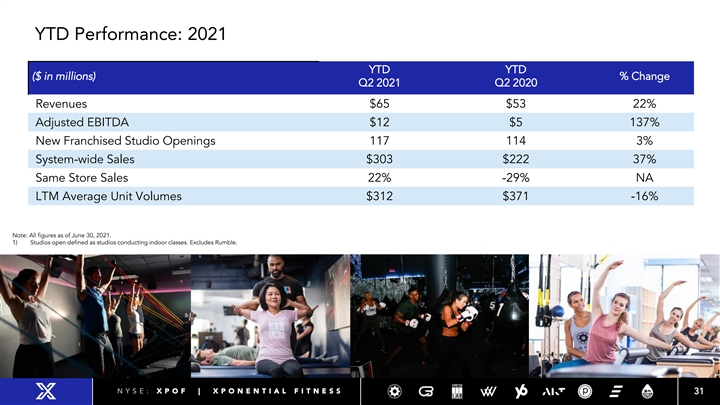
YTD Performance: 2021 YTD YTD ($ in millions) % Change Q2 2021 Q2 2020 Revenues $65 $53 22% Adjusted EBITDA $12 $5 137% New Franchised Studio Openings 117 114 3% System-wide Sales $303 $222 37% Same Store Sales 22% -29% NA LTM Average Unit Volumes $312 $371 -16% Note: All figures as of June 30, 2021. 1) Studios open defined as studios conducting indoor classes. Excludes Rumble. N Y S E : X P O F | X P O N E N T I A L F I T N E S S 31YTD Performance: 2021 YTD YTD ($ in millions) % Change Q2 2021 Q2 2020 Revenues $65 $53 22% Adjusted EBITDA $12 $5 137% New Franchised Studio Openings 117 114 3% System-wide Sales $303 $222 37% Same Store Sales 22% -29% NA LTM Average Unit Volumes $312 $371 -16% Note: All figures as of June 30, 2021. 1) Studios open defined as studios conducting indoor classes. Excludes Rumble. N Y S E : X P O F | X P O N E N T I A L F I T N E S S 31
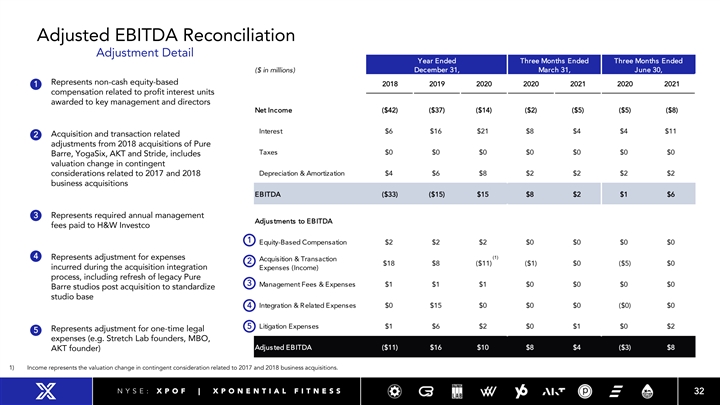
Adjusted EBITDA Reconciliation Adjustment Detail Year Ended Three Months Ended Three Months Ended December 31, March 31, June 30, ($ in millions) ◼ Represents non-cash equity-based 2018 2019 2020 2020 2021 2020 2021 1 compensation related to profit interest units awarded to key management and directors Net Income ($42) ($37) ($14) ($2) ($5) ($5) ($8) Interest $6 $16 $21 $8 $4 $4 $11 ◼ 2 Acquisition and transaction related adjustments from 2018 acquisitions of Pure Taxes $0 $0 $0 $0 $0 $0 $0 Barre, YogaSix, AKT and Stride, includes valuation change in contingent considerations related to 2017 and 2018 Depreciation & Amortization $4 $6 $8 $2 $2 $2 $2 business acquisitions EBITDA ($33) ($15) $15 $8 $2 $1 $6 ◼ 3 Represents required annual management Adjustments to EBITDA fees paid to H&W Investco 1 Equity-Based Compensation $2 $2 $2 $0 $0 $0 $0 4 (1) ◼ Represents adjustment for expenses Acquisition & Transaction 2 $18 $8 ($11) ($1) $0 ($5) $0 incurred during the acquisition integration Expenses (Income) process, including refresh of legacy Pure 3 Management Fees & Expenses $1 $1 $1 $0 $0 $0 $0 Barre studios post acquisition to standardize studio base 4 Integration & Related Expenses $0 $15 $0 $0 $0 ($0) $0 5 Litigation Expenses $1 $6 $2 $0 $1 $0 $2 ◼ Represents adjustment for one-time legal 5 expenses (e.g. Stretch Lab founders, MBO, Adjusted EBITDA ($11) $16 $10 $8 $4 ($3) $8 AKT founder) 1) Income represents the valuation change in contingent consideration related to 2017 and 2018 business acquisitions. N Y S E : X P O F | X P O N E N T I A L F I T N E S S 32Adjusted EBITDA Reconciliation Adjustment Detail Year Ended Three Months Ended Three Months Ended December 31, March 31, June 30, ($ in millions) ◼ Represents non-cash equity-based 2018 2019 2020 2020 2021 2020 2021 1 compensation related to profit interest units awarded to key management and directors Net Income ($42) ($37) ($14) ($2) ($5) ($5) ($8) Interest $6 $16 $21 $8 $4 $4 $11 ◼ 2 Acquisition and transaction related adjustments from 2018 acquisitions of Pure Taxes $0 $0 $0 $0 $0 $0 $0 Barre, YogaSix, AKT and Stride, includes valuation change in contingent considerations related to 2017 and 2018 Depreciation & Amortization $4 $6 $8 $2 $2 $2 $2 business acquisitions EBITDA ($33) ($15) $15 $8 $2 $1 $6 ◼ 3 Represents required annual management Adjustments to EBITDA fees paid to H&W Investco 1 Equity-Based Compensation $2 $2 $2 $0 $0 $0 $0 4 (1) ◼ Represents adjustment for expenses Acquisition & Transaction 2 $18 $8 ($11) ($1) $0 ($5) $0 incurred during the acquisition integration Expenses (Income) process, including refresh of legacy Pure 3 Management Fees & Expenses $1 $1 $1 $0 $0 $0 $0 Barre studios post acquisition to standardize studio base 4 Integration & Related Expenses $0 $15 $0 $0 $0 ($0) $0 5 Litigation Expenses $1 $6 $2 $0 $1 $0 $2 ◼ Represents adjustment for one-time legal 5 expenses (e.g. Stretch Lab founders, MBO, Adjusted EBITDA ($11) $16 $10 $8 $4 ($3) $8 AKT founder) 1) Income represents the valuation change in contingent consideration related to 2017 and 2018 business acquisitions. N Y S E : X P O F | X P O N E N T I A L F I T N E S S 32
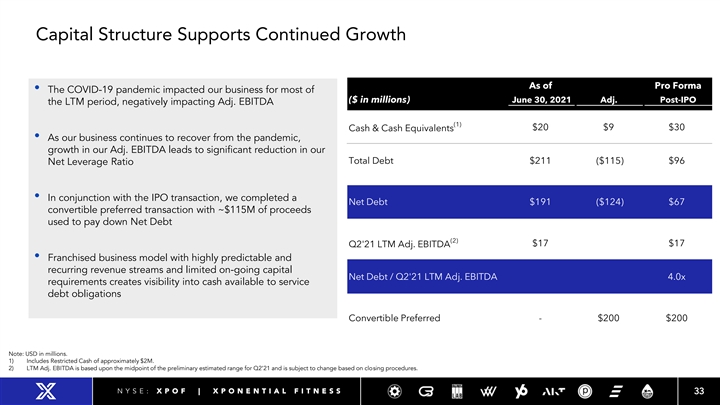
Capital Structure Supports Continued Growth As of Pro Forma • The COVID-19 pandemic impacted our business for most of ($ in millions) June 30, 2021 Adj. Post-IPO the LTM period, negatively impacting Adj. EBITDA (1) $20 $9 $30 Cash & Cash Equivalents • As our business continues to recover from the pandemic, growth in our Adj. EBITDA leads to significant reduction in our Total Debt $211 ($115) $96 Net Leverage Ratio • In conjunction with the IPO transaction, we completed a Net Debt $191 ($124) $67 convertible preferred transaction with ~$115M of proceeds used to pay down Net Debt pj (2) $17 $17 Q2'21 LTM Adj. EBITDA • Franchised business model with highly predictable and recurring revenue streams and limited on-going capital Net Debt / Q2'21 LTM Adj. EBITDA 4.0x requirements creates visibility into cash available to service debt obligations Convertible Preferred - $200 $200 Note: USD in millions. 1) Includes Restricted Cash of approximately $2M. 2) LTM Adj. EBITDA is based upon the midpoint of the preliminary estimated range for Q2’21 and is subject to change based on closing procedures. N Y S E : X P O F | X P O N E N T I A L F I T N E S S 33Capital Structure Supports Continued Growth As of Pro Forma • The COVID-19 pandemic impacted our business for most of ($ in millions) June 30, 2021 Adj. Post-IPO the LTM period, negatively impacting Adj. EBITDA (1) $20 $9 $30 Cash & Cash Equivalents • As our business continues to recover from the pandemic, growth in our Adj. EBITDA leads to significant reduction in our Total Debt $211 ($115) $96 Net Leverage Ratio • In conjunction with the IPO transaction, we completed a Net Debt $191 ($124) $67 convertible preferred transaction with ~$115M of proceeds used to pay down Net Debt pj (2) $17 $17 Q2'21 LTM Adj. EBITDA • Franchised business model with highly predictable and recurring revenue streams and limited on-going capital Net Debt / Q2'21 LTM Adj. EBITDA 4.0x requirements creates visibility into cash available to service debt obligations Convertible Preferred - $200 $200 Note: USD in millions. 1) Includes Restricted Cash of approximately $2M. 2) LTM Adj. EBITDA is based upon the midpoint of the preliminary estimated range for Q2’21 and is subject to change based on closing procedures. N Y S E : X P O F | X P O N E N T I A L F I T N E S S 33
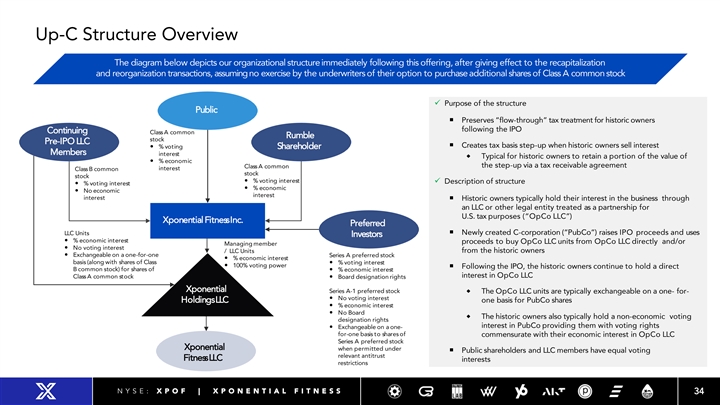
Up-C Structure Overview The diagram below depicts our organizational structureimmediately following this offering, after giving effect to the recapitalization and reorganization transactions, assuming no exercise by the underwriters of their option to purchaseadditional shares of Class A common stock ✓ Purpose of the structure Public ¡ Preserves “flow-through” tax treatment for historic owners following the IPO Continuing Class A common Rumble stock Pre-IPO LLC ¡ Creates tax basis step-up when historic owners sell interest — % voting Shareholder Members interest ® Typical for historic owners to retain a portion of the value of — % economic Class A common the step-up via a tax receivable agreement interest Class B common stock stock — % voting interest ✓ Description of structure — % voting interest — % economic — No economic interest interest ¡ Historic owners typically hold their interest in the business through an LLC or other legal entity treated as a partnership for U.S. tax purposes (“OpCo LLC”) Xponential FitnessInc. Preferred LLC Units¡ Newly created C-corporation (“PubCo”) raises IPO proceeds and uses Investors — % economic interest proceeds to buy OpCo LLC units from OpCo LLC directly and/or Managing member — No voting interest / LLC Units from the historic owners — Exchangeable on a one-for-one Series A preferred stock — % economic interest basis (along with shares of Class — % voting interest — 100% voting power ¡ Following the IPO, the historic owners continue to hold a direct B common stock) for shares of — % economic interest interest in OpCo LLC Class A common stock— Board designation rights Xponential Series A-1 preferred stock ® The OpCo LLC units are typically exchangeable on a one- for- — No voting interest HoldingsLLC one basis for PubCo shares — % economic interest — No Board ® The historic owners also typically hold a non-economic voting designation rights interest in PubCo providing them with voting rights — Exchangeable on a one- for-one basis to shares of commensurate with their economic interest in OpCo LLC Series A preferred stock Xponential when permitted under ¡ Public shareholders and LLC members have equal voting relevant antitrust FitnessLLC interests restrictions N Y S E : X P O F | X P O N E N T I A L F I T N E S S 34Up-C Structure Overview The diagram below depicts our organizational structureimmediately following this offering, after giving effect to the recapitalization and reorganization transactions, assuming no exercise by the underwriters of their option to purchaseadditional shares of Class A common stock ✓ Purpose of the structure Public ¡ Preserves “flow-through” tax treatment for historic owners following the IPO Continuing Class A common Rumble stock Pre-IPO LLC ¡ Creates tax basis step-up when historic owners sell interest — % voting Shareholder Members interest ® Typical for historic owners to retain a portion of the value of — % economic Class A common the step-up via a tax receivable agreement interest Class B common stock stock — % voting interest ✓ Description of structure — % voting interest — % economic — No economic interest interest ¡ Historic owners typically hold their interest in the business through an LLC or other legal entity treated as a partnership for U.S. tax purposes (“OpCo LLC”) Xponential FitnessInc. Preferred LLC Units¡ Newly created C-corporation (“PubCo”) raises IPO proceeds and uses Investors — % economic interest proceeds to buy OpCo LLC units from OpCo LLC directly and/or Managing member — No voting interest / LLC Units from the historic owners — Exchangeable on a one-for-one Series A preferred stock — % economic interest basis (along with shares of Class — % voting interest — 100% voting power ¡ Following the IPO, the historic owners continue to hold a direct B common stock) for shares of — % economic interest interest in OpCo LLC Class A common stock— Board designation rights Xponential Series A-1 preferred stock ® The OpCo LLC units are typically exchangeable on a one- for- — No voting interest HoldingsLLC one basis for PubCo shares — % economic interest — No Board ® The historic owners also typically hold a non-economic voting designation rights interest in PubCo providing them with voting rights — Exchangeable on a one- for-one basis to shares of commensurate with their economic interest in OpCo LLC Series A preferred stock Xponential when permitted under ¡ Public shareholders and LLC members have equal voting relevant antitrust FitnessLLC interests restrictions N Y S E : X P O F | X P O N E N T I A L F I T N E S S 34
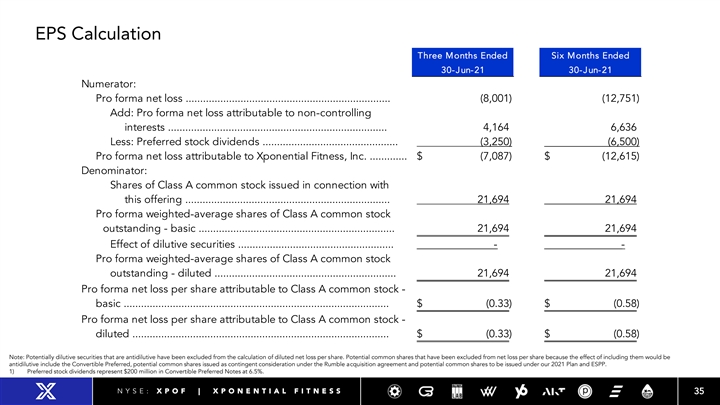
EPS Calculation Three Months Ended Six Months Ended 30-Jun-21 30-Jun-21 Numerator: Pro forma net loss ....................................................................... ( 8,001) (12,751) Add: Pro forma net loss attributable to non-controlling interests ............................................................................. 4,164 6,636 Less: Preferred stock dividends ............................................... (3,250) (6,500) Pro forma net loss attributable to Xponential Fitness, Inc. .............. $ ( 7,087) $ (12,615) Denominator: Shares of Class A common stock issued in connection with this offering ....................................................................... 21,694 21,694 Pro forma weighted-average shares of Class A common stock outstanding - basic .................................................................... 21,694 21,694 Effect of dilutive securities ...................................................... - - Pro forma weighted-average shares of Class A common stock outstanding - diluted ............................................................... 2 1,694 21,694 Pro forma net loss per share attributable to Class A common stock - basic ............................................................................................. $ ( 0.33) $ ( 0.58) Pro forma net loss per share attributable to Class A common stock - diluted .......................................................................................... $ ( 0.33) $ ( 0.58) Note: Potentially dilutive securities that are antidilutive have been excluded from the calculation of diluted net loss per share. Potential common shares that have been excluded from net loss per share because the effect of including them would be antidilutive include the Convertible Preferred, potential common shares issued as contingent consideration under the Rumble acquisition agreement and potential common shares to be issued under our 2021 Plan and ESPP. 1) Preferred stock dividends represent $200 million in Convertible Preferred Notes at 6.5%. N Y S E : X P O F | X P O N E N T I A L F I T N E S S 35EPS Calculation Three Months Ended Six Months Ended 30-Jun-21 30-Jun-21 Numerator: Pro forma net loss ....................................................................... ( 8,001) (12,751) Add: Pro forma net loss attributable to non-controlling interests ............................................................................ 4,164 6,636 Less: Preferred stock dividends ............................................... (3,250) (6,500) Pro forma net loss attributable to Xponential Fitness, Inc. ............. $ ( 7,087) $ (12,615) Denominator: Shares of Class A common stock issued in connection with this offering ....................................................................... 21,694 21,694 Pro forma weighted-average shares of Class A common stock outstanding - basic .................................................................... 21,694 21,694 Effect of dilutive securities ...................................................... - - Pro forma weighted-average shares of Class A common stock outstanding - diluted ............................................................... 2 1,694 21,694 Pro forma net loss per share attributable to Class A common stock - basic ............................................................................................. $ ( 0.33) $ ( 0.58) Pro forma net loss per share attributable to Class A common stock - diluted .......................................................................................... $ ( 0.33) $ ( 0.58) Note: Potentially dilutive securities that are antidilutive have been excluded from the calculation of diluted net loss per share. Potential common shares that have been excluded from net loss per share because the effect of including them would be antidilutive include the Convertible Preferred, potential common shares issued as contingent consideration under the Rumble acquisition agreement and potential common shares to be issued under our 2021 Plan and ESPP. 1) Preferred stock dividends represent $200 million in Convertible Preferred Notes at 6.5%. N Y S E : X P O F | X P O N E N T I A L F I T N E S S 35
CONTACT: Addo Investor Relations investor@xponential.com N Y S E : X P O F | X P O N E N T I A L F I T N E S S 36CONTACT: Addo Investor Relations investor@xponential.com N Y S E : X P O F | X P O N E N T I A L F I T N E S S 36